February 27, 2026 a 12:46 pm
IR: Dividend Analysis - Ingersoll Rand Inc.
Ingersoll Rand demonstrates a solid commitment to dividends, with a long history of providing returns to its shareholders. However, recent stagnation in dividend growth may concern some income-focused investors. While the current payout ratios are conservative, indicating potential for future increases, the company's sustained financial strategies will be crucial for long-term dividend sustainability.
📊 Overview
Understanding the stock's recent performance and industry standing is paramount for evaluating its potential for dividend returns.
| Metric | Value |
|---|---|
| Sector | Industrials |
| Dividend Yield | 0.08% |
| Current Dividend per Share | 0.0799 USD |
| Dividend History | 10 years |
| Last Cut or Suspension | None |
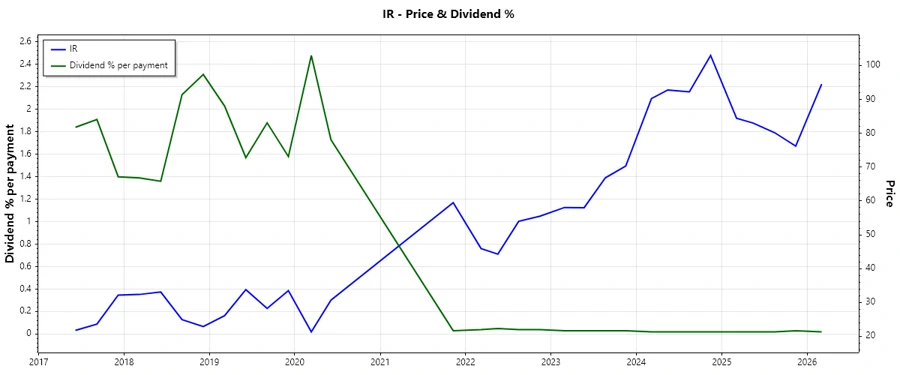
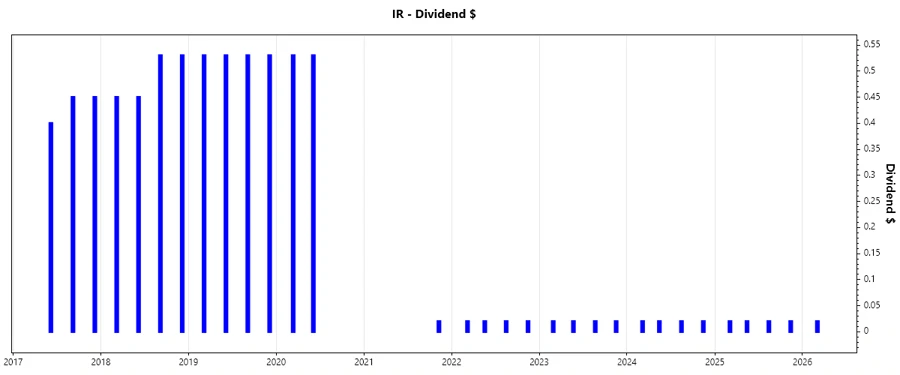
🗣️ Dividend History
A historic perspective on dividends helps evaluate the reliability of payout strategies. Consistency signals stability, key for income investors.
| Year | Dividend per Share (USD) |
|---|---|
| 2026 | 0.02 |
| 2025 | 0.08 |
| 2024 | 0.08 |
| 2023 | 0.08 |
| 2022 | 0.08 |
📈 Dividend Growth
Analyzing the growth trajectory gives insight into future payout potential, vital for strategy alignment with financial goals.
| Time | Growth |
|---|---|
| 3 years | 0% |
| 5 years | -40.36% |
The average dividend growth is -40.36% over 5 years. This shows a concerning trend of declining dividend growth, prompting scrutiny of future earnings to support dividends.
📉 Payout Ratio
The payout ratio measures a company's earnings and cash flow used to pay dividends, reflecting financial health and sustainability.
| Key figure | Ratio |
|---|---|
| EPS-based | 5.40% |
| Free cash flow-based | 2.59% |
A low EPS-based payout ratio of 5.40% indicates a cautious approach to dividend payments, suggesting plenty of room for increasing payouts, if desired.
✅ Cashflow & Capital Efficiency
Cashflow dynamics and capital allocations define a company's operational success and future strategic capacities.
| Year | Free Cash Flow Yield | Earnings Yield | CAPEX to Operating Cash Flow | Stock-based Compensation to Revenue | Free Cash Flow / Operating Cash Flow Ratio |
|---|---|---|---|---|---|
| 2025 | 3.87% | 1.84% | 10.0% | 0% | 89.87% |
| 2024 | 3.42% | 2.30% | 10.7% | 0.81% | 89.32% |
| 2023 | 4.06% | 2.49% | 7.7% | 0.75% | 92.35% |
The measures suggest a steady cash flow status enhancing capital efficiency and the potential for sustaining or increasing dividends over time.
⚠️ Balance Sheet & Leverage Analysis
A robust balance sheet and prudent leverage ratios ensure operational resilience against market fluctuations.
| Year | Debt-to-Equity | Debt-to-Assets | Debt-to-Capital | Net Debt to EBITDA | Current Ratio | Quick Ratio | Financial Leverage |
|---|---|---|---|---|---|---|---|
| 2025 | 47.42% | 26.15% | 32.17% | 1.84 | 2.06 | 1.49 | 1.81 |
| 2024 | 48.93% | 27.65% | 32.85% | 1.88 | 2.29 | 1.71 | 1.77 |
| 2023 | 28.26% | 17.77% | 22.04% | 0.71 | 2.22 | 1.67 | 1.59 |
The lower Debt-to-Equity in 2023 reflects improved financial health, enabling the company to expand its financial strategies wisely.
🗠 Fundamental Strength & Profitability
Analyzing profitability and core fundamental metrics highlights financial resilience essential for future growth initiatives.
| Year | Return on Equity | Return on Assets | Net Margin | EBITDA Margin | R&D to Revenue |
|---|---|---|---|---|---|
| 2025 | 5.76% | 3.18% | 7.60% | 25.14% | 0% |
| 2024 | 8.24% | 4.66% | 11.59% | 25.27% | 0% |
| 2023 | 7.96% | 5.00% | 11.32% | 23.95% | 0% |
The profitability measures are robust, with consistent returns on equity and assets, supporting potential for shareholder value enhancement.
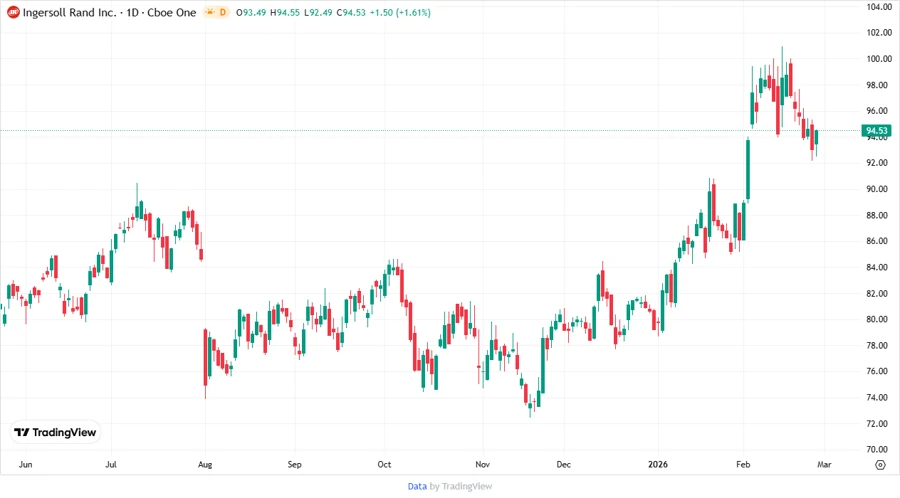
📉 Price Development
🛠 Dividend Scoring System
| Criterion | Score | Score Bar |
|---|---|---|
| Dividend Yield | 2/5 | |
| Dividend Stability | 3/5 | |
| Dividend Growth | 1/5 | |
| Payout Ratio | 5/5 | |
| Financial Stability | 4/5 | |
| Dividend Continuity | 4/5 | |
| Cashflow Coverage | 4/5 | |
| Balance Sheet Quality | 3/5 |
Total Score: 26/40
⭐ Rating
Ingersoll Rand Inc. exhibits strong financial health and commitment to dividends, albeit with recent growth challenges. The low payout ratios and solid cash flow metrics suggest room for dividend enhancement. Investors should monitor strategic developments to align with long-term yield expectations.
Smart Data Insight
Master the Perfect Entry & Exit for this Stock
Don't leave your profits to chance. Historically, this stock follows specific seasonal patterns that institutional traders use to maximize returns.
- ✅ Identify the "Golden Buying Window"
- ✅ Avoid high-risk correction cycles
- ✅ Backtested data from the last 20+ years