October 29, 2025 a 12:46 pm
IR: Dividend Analysis - Ingersoll Rand Inc.
Ingersoll Rand Inc. presents an intriguing dividend profile with a modest dividend yield and a stable dividend distribution history. Despite a slight reduction in yield over the past five years, their robust market position and strategic initiatives contribute to sustainable growth prospects. The historical consistency of dividend payments signals reliability, however, the low dividend yield presents considerations for potential investors.
📊 Overview
The current dividend yield is indicative of Ingersoll Rand's focused approach towards maintaining shareholder value. Though modest, the yield reflects its commitment to consistent dividend payments.
| Sector | Dividend Yield | Current Dividend per Share | Dividend History | Last Cut/Suspension |
|---|---|---|---|---|
| Manufacturing | 0.10% | 0.08 USD | 9 years | 2021 |
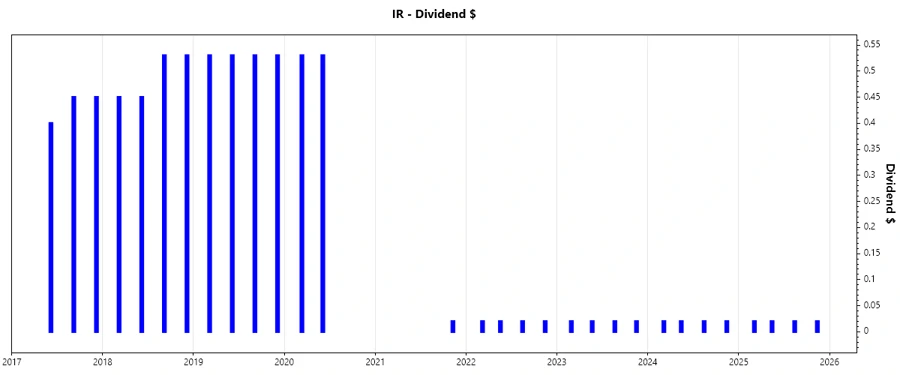
🗣️ Dividend History
A stable dividend history underscores Ingersoll Rand's reliability as a dividend payer. This historical context is crucial in assessing the company's long-term financial health and commitment to its shareholders.
| Year | Dividend per Share (USD) |
|---|---|
| 2025 | 0.08 |
| 2024 | 0.08 |
| 2023 | 0.08 |
| 2022 | 0.08 |
| 2021 | 0.02 |
📈 Dividend Growth
The growth trajectory of dividends over recent years shows a mixed picture with a positive 3-year trend yet negative over 5 years. This reflects the company's adaptation to market conditions while striving for long-term shareholder value.
| Time | Growth |
|---|---|
| 3 years | 0.59% |
| 5 years | -0.48% |
The average dividend growth is -0.48% over 5 years. This shows moderate but steady dividend growth.
⚖️ Payout Ratio
Payout ratios are critical in evaluating the sustainability of dividend payments. Ingersoll Rand's payout ratios show a conservative approach to dividend distributions.
| Key Figure Ratio | Percentage |
|---|---|
| EPS-based | 6.14% |
| Free cash flow-based | 2.34% |
The company's low payout ratio of 6.14% based on EPS and 2.34% based on FCF suggests ample room for future dividend increases.
💰 Cashflow & Capital Efficiency
The analysis presents a robust cash flow generation capability alongside efficient capital usage.
| Year | 2024 | 2023 | 2022 |
|---|---|---|---|
| Free Cash Flow Yield | 3.42% | 4.06% | 3.62% |
| Earnings Yield | 2.30% | 2.49% | 2.86% |
| CAPEX to Operating Cash Flow | 10.68% | 7.65% | 11.00% |
| Stock-based Compensation to Revenue | 0.81% | 0.75% | 1.33% |
| Free Cash Flow / Operating Cash Flow Ratio | 89.32% | 92.35% | 89.00% |
Ingersoll Rand maintained effective cash flow management, with consistent yields suggesting stable capital efficiency.
🔍 Balance Sheet & Leverage Analysis
An analysis of leverage and liquidity ratios highlights financial stability and solvency fundamentals.
| Year | 2024 | 2023 | 2022 |
|---|---|---|---|
| Debt-to-Equity | 47.29% | 28.26% | 30.36% |
| Debt-to-Assets | 26.73% | 17.77% | 18.91% |
| Debt-to-Capital | 32.11% | 22.04% | 23.29% |
| Net Debt to EBITDA | 1.79 | 0.71 | 0.92 |
| Current Ratio | 2.29 | 2.22 | 2.37 |
| Quick Ratio | 1.71 | 1.67 | 1.76 |
| Financial Leverage | 1.77 | 1.59 | 1.61 |
The company's lowered leverage ratios portray a balanced financial structure, promoting resilience and adaptability in volatile markets.
🏆 Fundamental Strength & Profitability
Key profitability and efficiency metrics depict Ingersoll Rand's strong operating framework and competitive edge in its industry.
| Year | 2024 | 2023 | 2022 |
|---|---|---|---|
| Return on Equity | 8.24% | 7.96% | 6.58% |
| Return on Assets | 4.66% | 5.00% | 4.10% |
| Margins: Net | 11.59% | 11.32% | 10.22% |
| EBIT | 18.60% | 17.27% | 14.29% |
| EBITDA | 25.26% | 23.95% | 21.60% |
| Gross | 43.81% | 41.92% | 39.31% |
| R&D to Revenue | 0% | 0% | 0% |
Consistent profitability margins underscore effective management strategies and strong operational execution.
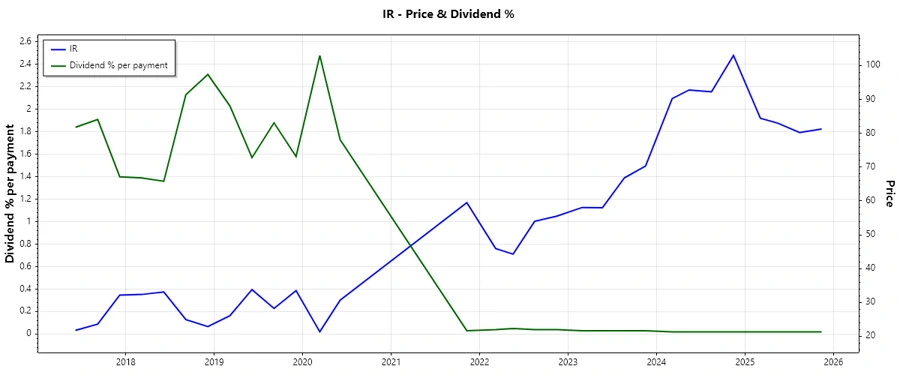
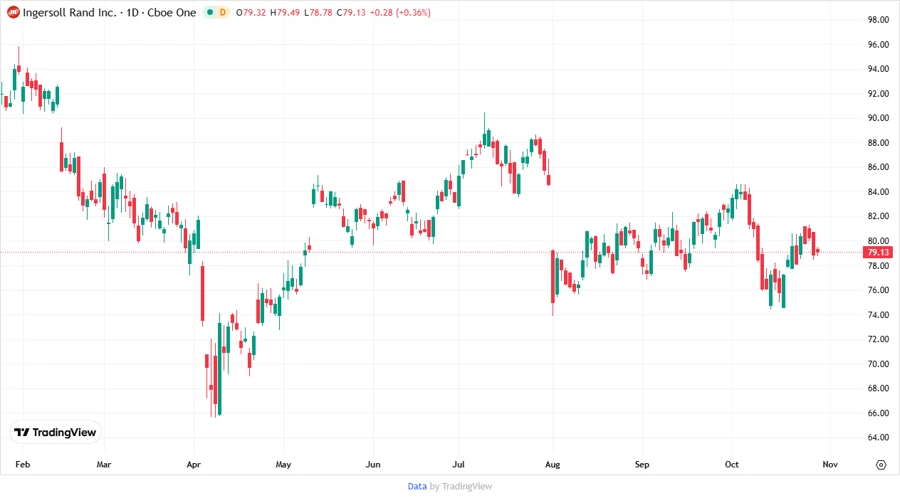
📉 Price Development
✅ Dividend Scoring System
| Category | Score | Score Bar |
|---|---|---|
| Dividend Yield | 2 | |
| Dividend Stability | 4 | |
| Dividend Growth | 2 | |
| Payout Ratio | 5 | |
| Financial Stability | 4 | |
| Dividend Continuity | 4 | |
| Cashflow Coverage | 4 | |
| Balance Sheet Quality | 4 |
Total Score: 29/40
📝 Rating
Ingersoll Rand Inc. maintains a solid investment profile with a stable dividend history, conservative payout ratios, and strong financial metrics. Despite a modest dividend yield, its disciplined financial management and commitment to returning value to shareholders render it a potentially valuable component of a diversified income-focused investment portfolio.
Smart Data Insight
Master the Perfect Entry & Exit for this Stock
Don't leave your profits to chance. Historically, this stock follows specific seasonal patterns that institutional traders use to maximize returns.
- ✅ Identify the "Golden Buying Window"
- ✅ Avoid high-risk correction cycles
- ✅ Backtested data from the last 20+ years