September 29, 2025 a 03:32 am


IR: Dividend Analysis - Ingersoll Rand Inc.
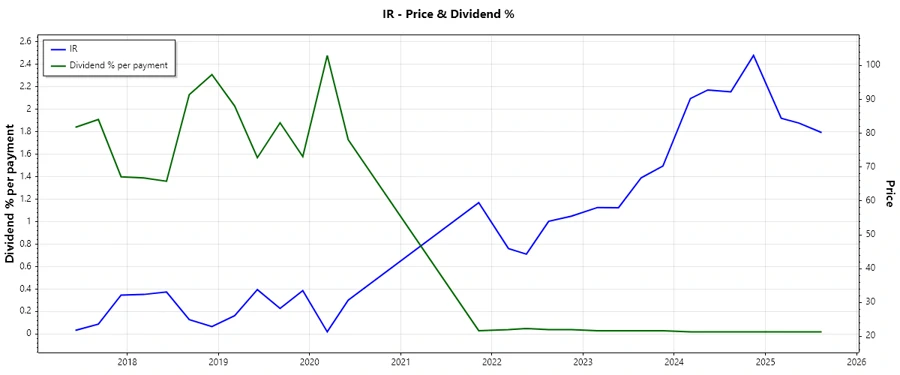
Ingersoll Rand Inc. presents a unique dividend profile characterized by a historically low dividend yield but consistent dividend payments over the past nine years. Despite the low yield, the company’s financial health and commitment to shareholder returns make it a stock worth considering for those seeking stable income sources.
Overview 📊
Analyzing the core dividend metrics for Ingersoll Rand Inc. provides insight into its capacity to distribute profits to shareholders over time. With a nine-year history of paying dividends, the company has demonstrated resilience in its payout policy.
| Metric | Value |
|---|---|
| Sector | Industrials |
| Dividend yield | 0.10% |
| Current dividend per share | $0.08 |
| Dividend history | 9 years |
| Last cut or suspension | None |
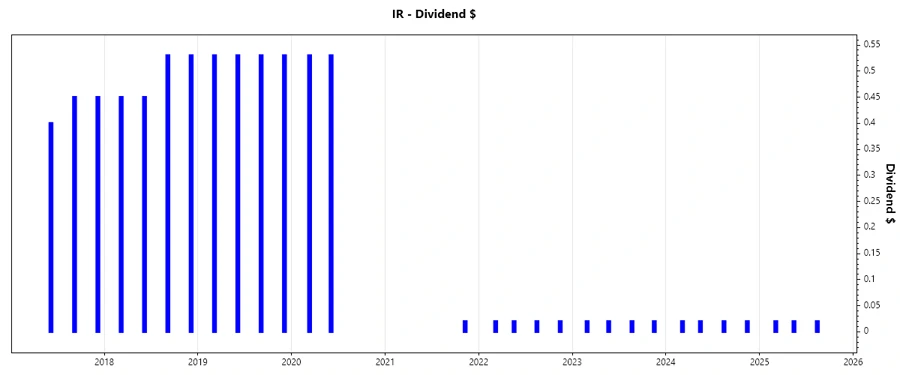
Dividend History 🗣️
The stability and pattern in dividend payments are crucial indicators of commitment to returning cash to shareholders. A ninth consecutive year with dividends showcases the company's robust strategy and consistent cash flow management.
| Year | Dividend per Share (USD) |
|---|---|
| 2025 | $0.06 |
| 2024 | $0.08 |
| 2023 | $0.08 |
| 2022 | $0.08 |
| 2021 | $0.02 |
Dividend Growth 📈
Assessing growth patterns provide insights into the company’s ability to increase payouts sustainably. The negative growth over five years may be seen as a lack of growth focus or adaptation to environmental challenges.
| Time | Growth |
|---|---|
| 3 years | 0.59% |
| 5 years | -0.48% |
The average dividend growth is -0.48% over 5 years. This shows moderate but steady dividend growth.
Payout Ratio ✅
Payout ratio analysis reveals how much of the company’s earnings and cash flow are used to pay dividends. The modest payout rates suggest the company retains most earnings for reinvestment or other strategic initiatives.
| Key figure | Ratio |
|---|---|
| EPS-based | 6.14% |
| Free cash flow-based | 2.34% |
The EPS payout ratio of 6.14% and FCF payout ratio of 2.34% indicate a conservative dividend policy, preserving the bulk of earnings for growth or other opportunities.
Cashflow & Capital Efficiency 💵
Evaluating cash flow and capital efficiency uncovers how effectively the company utilizes its resources to generate returns for shareholders. These metrics also highlight the firm’s operational efficacy and financial prudence.
| Metric | 2022 | 2023 | 2024 |
|---|---|---|---|
| Free Cash Flow Yield | 3.62% | 4.06% | 3.42% |
| Earnings Yield | 2.86% | 2.49% | 2.30% |
| CAPEX to Operating Cash Flow | 10.99% | 7.65% | 10.68% |
| Stock-based Compensation to Revenue | 1.33% | 0.75% | 0.81% |
| Free Cash Flow / Operating Cash Flow Ratio | 89.00% | 92.35% | 89.32% |
The firm's consistent cash flow generation and capital efficiency emphasize its capacity to uphold dividend payments and pursue strategic investments sustainably.
Balance Sheet & Leverage Analysis 📉
A strong balance sheet is essential for maintaining financial flexibility and navigating market challenges. Key leverage ratios reflect the company’s debt strategy and liquidity position.
| Metric | 2022 | 2023 | 2024 |
|---|---|---|---|
| Debt-to-Equity | 30.36% | 28.26% | 47.29% |
| Debt-to-Assets | 18.91% | 17.77% | 26.73% |
| Debt-to-Capital | 23.29% | 22.03% | 32.11% |
| Net Debt to EBITDA | 0.92 | 0.71 | 1.79 |
| Current Ratio | 2.37 | 2.22 | 2.29 |
| Quick Ratio | 1.76 | 1.67 | 1.71 |
| Financial Leverage | 1.61 | 1.59 | 1.77 |
The firm exhibits considerable financial backbone, with leverage ratios indicating prudent debt levels that support its ongoing fiscal responsibilities.
Fundamental Strength & Profitability 📈
Profitability metrics reflect the effectiveness of management’s strategies; understanding these figures is crucial for evaluating Ingersoll Rand’s competitive stance.
| Metric | 2022 | 2023 | 2024 |
|---|---|---|---|
| Return on Equity | 6.58% | 7.96% | 8.24% |
| Return on Assets | 4.10% | 5.00% | 4.66% |
| Net Profit Margin | 10.22% | 11.32% | 11.59% |
| EBIT Margin | 14.29% | 17.27% | 18.60% |
| EBITDA Margin | 21.60% | 23.95% | 25.27% |
| Gross Margin | 39.31% | 41.92% | 43.81% |
| Research & Development to Revenue | 0.00% | 0.00% | 0.00% |
The increasing profit margins and return metrics verify strategically efficient operations, although the lack of R&D expenditure could question future innovation.
Price Development 📈
Dividend Scoring System ✅
| Category | Score | Score Bar |
|---|---|---|
| Dividend yield | 1 | |
| Dividend Stability | 4 | |
| Dividend growth | 2 | |
| Payout ratio | 4 | |
| Financial stability | 5 | |
| Dividend continuity | 5 | |
| Cashflow Coverage | 4 | |
| Balance Sheet Quality | 5 |
Total Score: 30/40
Rating 🗣️
Ingersoll Rand Inc. earns a solid dividend rating, driven by its excellent financial stability and consistent dividend history. However, the low dividend yield and stagnant dividend growth hold back a more enthusiastic endorsement for yield-seeking investors.