July 21, 2025 a 12:46 pm


IR: Dividend Analysis - Ingersoll Rand Inc.
Ingersoll Rand Inc., based on current financial metrics, presents a compelling yet cautious picture for dividend investors. Despite a low dividend yield, the company's consistent history and steady cash flow provide stability. However, concerns arise from its modest dividend growth over the last five years, highlighting the need for investor vigilance in monitoring future performance.
📊 Overview
The analysis of Ingersoll Rand Inc. reveals a diversified approach within the industrial sector. The company's dividend yield stands at a minimal 0.12%, with a current dividend per share pegged at $0.080. Over a commendable history of 9 years without significant suspensions or cuts, Ingersoll Rand demonstrates reliability.
| Metric | Details |
|---|---|
| Sector | Industrial |
| Dividend yield | 0.12% |
| Current dividend per share | $0.08 |
| Dividend history | 9 years |
| Last cut or suspension | None |
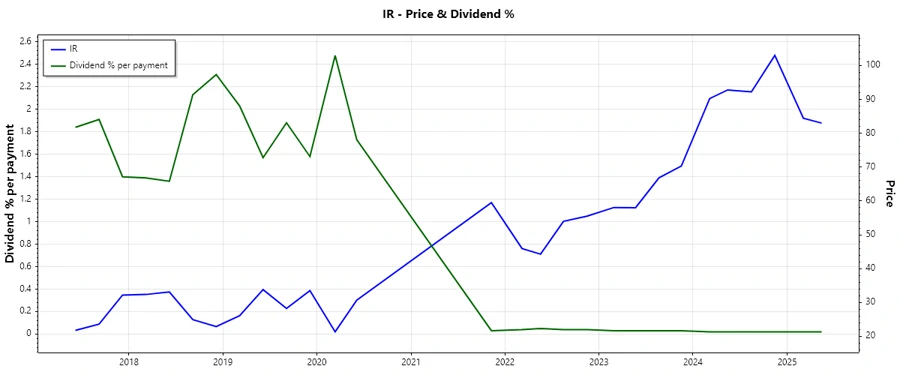
🗣️ Dividend History
The historical dividend data provides insight into consistency and the potential reliability for income generation, revealing Ingersoll Rand's resilience over diverse market conditions. Their dividend approach is indicative of a firm grounding even amidst challenging times.
| Year | Dividend Per Share (USD) |
|---|---|
| 2025 | 0.04 |
| 2024 | 0.08 |
| 2023 | 0.08 |
| 2022 | 0.08 |
| 2021 | 0.02 |
📈 Dividend Growth
Examining the dividend growth over the past years emphasizes the company's approach to shareholder value, highlighting both potential growth and areas of caution. In the last 3 years, there's been a 0.59% increment, however, there's a decline noticed at -0.48% over 5 years.
| Time | Growth |
|---|---|
| 3 years | 0.59% |
| 5 years | -0.48% |
The average dividend growth is -0.48% over 5 years. This reflects a period of moderate yet critical assessment for future decisions.
✅ Payout Ratio
The payout ratios provide valuable insights into how well the company manages its earnings versus cash flow to meet its dividend obligations. Currently, the EPS-based payout ratio is low at 3.93%, while the free cash flow-based ratio is even lower at 2.26%.
| Key figure ratio | Percentage |
|---|---|
| EPS-based | 3.93% |
| Free cash flow-based | 2.26% |
These ratios suggest a conservative dividend strategy, providing buffer during profit fluctuations.
📈 Cashflow & Capital Efficiency
The robustness of Ingersoll Rand's cash flow illustrates its efficiency in capital allocation and ability to sustain shareholder returns. Key measures here affirm its capability to cover dividends and reinvest into core operations.
| Year | 2024 | 2023 | 2022 |
|---|---|---|---|
| Free Cash Flow Yield | 3.42% | 4.06% | 3.62% |
| Earnings Yield | 2.30% | 2.49% | 2.86% |
| CAPEX to Operating Cash Flow | 10.68% | 7.65% | 10.99% |
| Stock-based Compensation to Revenue | 0.81% | 0.75% | 1.33% |
| Free Cash Flow / Operating Cash Flow Ratio | 89.32% | 92.35% | 89.00% |
The analysis shows a well-managed cash flow, with strong capital efficiency ratios evidencing effective resource utilization.
⚠️ Balance Sheet & Leverage Analysis
Ingersoll Rand demonstrates prudence in its leverage management, reflecting discipline in balancing debt levels with equity to secure financial stability.
| Year | 2024 | 2023 | 2022 |
|---|---|---|---|
| Debt-to-Equity | 0.47 | 0.28 | 0.30 |
| Debt-to-Assets | 0.27 | 0.18 | 0.19 |
| Debt-to-Capital | 0.32 | 0.22 | 0.23 |
| Net Debt to EBITDA | 1.82 | 0.71 | 0.87 |
| Current Ratio | 2.38 | 2.22 | 2.37 |
| Quick Ratio | 1.71 | 1.67 | 1.76 |
| Financial Leverage | 1.77 | 1.59 | 1.61 |
Consistent leverage ratios and high liquidity reflect a stable financial position, ensuring operational and strategic agility.
💹 Fundamental Strength & Profitability
The core profitability and economic moat of Ingersoll Rand are supported by robust margin management and steady returns, entailing a strategic edge in its operations.
| Year | 2024 | 2023 | 2022 |
|---|---|---|---|
| Return on Equity | 8.24% | 7.96% | 6.58% |
| Return on Assets | 4.66% | 5.00% | 4.10% |
| Margins: Net | 11.59% | 11.32% | 10.22% |
| Margins: EBIT | 18.60% | 17.27% | 14.29% |
| Margins: EBITDA | 24.80% | 23.95% | 22.18% |
| Margins: Gross | 43.81% | 41.92% | 39.31% |
| Research & Development to Revenue | 0.00% | 1.57% | 1.54% |
The company’s substantial profit margins underline its operational prowess, while consistent returns advocate strong strategic positions.
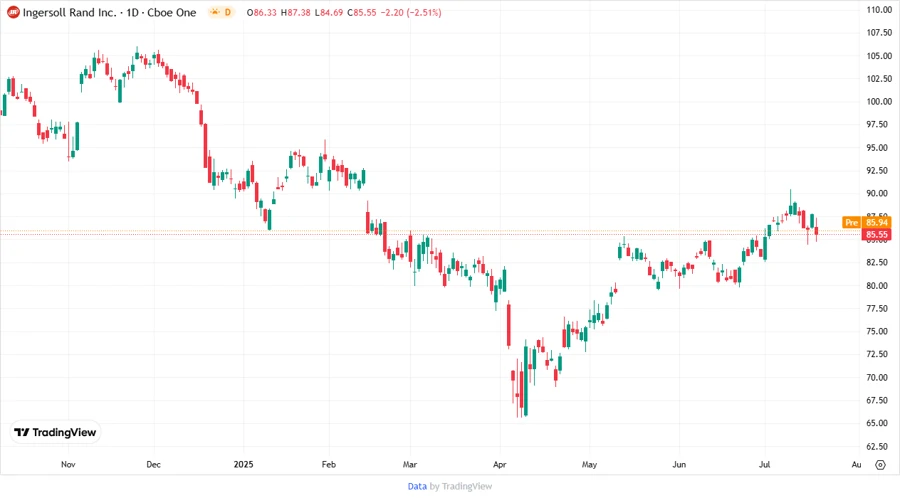
🔄 Price Development
🏆 Dividend Scoring System
| Criteria | Score | Score Bar |
|---|---|---|
| Dividend yield | 2 | |
| Dividend Stability | 4 | |
| Dividend growth | 2 | |
| Payout ratio | 5 | |
| Financial stability | 4 | |
| Dividend continuity | 4 | |
| Cashflow Coverage | 4 | |
| Balance Sheet Quality | 4 |
Total Score: 29/40
📉 Rating
Overall, Ingersoll Rand Inc. presents a moderately attractive proposition for dividend-focused investors, characterized by stability and robust financial management. The company's conservative payout ratios and solid balance sheet suggest a resilient dividend strategy despite modest yield and growth figures. Future monitoring of strategic developments and market conditions will be pivotal in assessing true long-term value. The recommendation is to hold with a cautious outlook for potential opportunistic reviews.
Smart Data Insight
Master the Perfect Entry & Exit for this Stock
Don't leave your profits to chance. Historically, this stock follows specific seasonal patterns that institutional traders use to maximize returns.
- ✅ Identify the "Golden Buying Window"
- ✅ Avoid high-risk correction cycles
- ✅ Backtested data from the last 20+ years