July 02, 2026 a 12:46 pm


IRM: Dividend Analysis - Iron Mountain Incorporated
Iron Mountain Incorporated presents an intriguing dividend profile with a modest yield yet a robust historical consistency. The company has maintained a stable dividend for 17 years, showcasing a commendable commitment to shareholder returns. However, with high payout ratios, the sustainability of future dividends may be under scrutiny, especially given the negative free cash flow yield. Investors should weigh these factors carefully when considering the firm's dividend viability.
📊 Overview
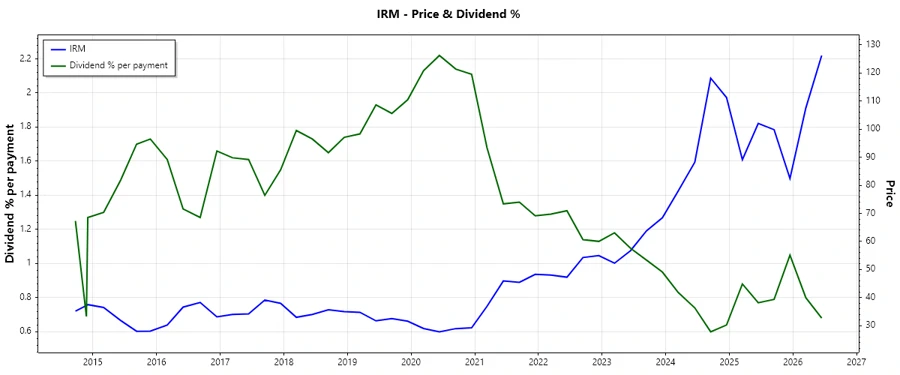
Iron Mountain operates primarily in the technology and data center sector, a field known for potential growth. However, its current dividend yield stands at 2.67%, with a considerably high payout ratio, which may flag caution for investors seeking secure dividend income.
| Sector | Dividend Yield | Current Dividend Per Share | Dividend History | Last Cut/Suspension |
|---|---|---|---|---|
| Technology/Data Center | 2.67% | 3.11 USD | 17 years | None |
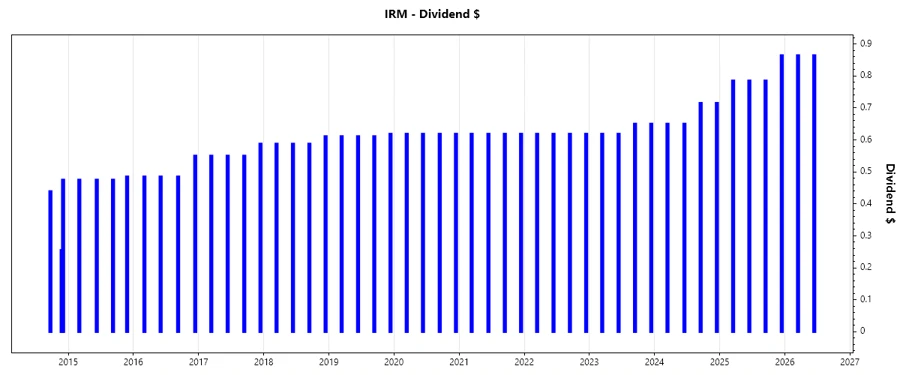
📈 Dividend History
Iron Mountain's dividend history is pivotal as it signals stability. With no cuts in 17 years, it provides assurance to investors about its commitment to return capital to shareholders. This reliability is crucial, especially during economic downturns.
| Year | Dividend Per Share (USD) |
|---|---|
| 2026 | 1.728 |
| 2025 | 3.219 |
| 2024 | 2.730 |
| 2023 | 2.537 |
| 2022 | 2.474 |
📉 Dividend Growth
Dividend growth is a key component of long-term returns. Iron Mountain has shown a 3-year growth rate of 0.09% and a 5-year growth rate of 0.05%. While growth is moderate, it does indicate a certain level of reliability for incremental income.
| Time | Growth |
|---|---|
| 3 years | 0.09% |
| 5 years | 0.05% |
The average dividend growth is 0.05% over 5 years. This shows moderate but steady dividend growth.
✅ Payout Ratio
Payout ratios offer insights into dividend sustainability. Iron Mountain's EPS-based payout ratio is alarmingly high at 339%, suggesting potential pressure on future dividend capabilities, particularly since its FCF payout ratio is also concerning at -147%.
| Key Figure | Ratio |
|---|---|
| EPS-based | 339% |
| Free cash flow-based | -147% |
The high EPS payout ratio raises red flags on the sustainability of dividends, necessitating caution.
🗣️ Cashflow & Capital Efficiency
The efficiency of capital utilization is paramount. Particularly the CAPEX to Operating Cash Flow ratio standing over 1 signals aggressive reinvestment, which may strain free cash flow, a critical concern for dividend sustainability.
| Year | 2023 | 2024 | 2025 |
|---|---|---|---|
| Free Cash Flow Yield | -1.13% | -2.13% | -3.80% |
| Earnings Yield | 0.90% | 0.58% | 0.59% |
| CAPEX/Operating Cash Flow | 1.21 | 1.55 | 1.70 |
| Stock-based Compensation/Revenue | 1.35% | 1.92% | 2.03% |
| Free Cash Flow/Operating Cash Flow | -20.79% | -54.92% | -69.52% |
The negative free cash flow and high CAPEX to cash flow ratio indicate strained cash flow stability and low return on investment.
📊 Balance Sheet & Leverage Analysis
The balance sheet offers a mixed picture with high net debt levels. The leverage ratios like Debt-to-Equity being negative portray significant financial gearing, highlighting potential stress on liquidity and long-term debt repayment capability.
| Year | 2023 | 2024 | 2025 |
|---|---|---|---|
| Debt-to-Equity | 69.87 | -32.54 | -19.42 |
| Debt-to-Assets | 84.63% | 87.46% | 90.18% |
| Net Debt/EBITDA | 9.00 | 8.50 | 9.07 |
| Current Ratio | 0.78 | 0.55 | 0.74 |
| Quick Ratio | 0.78 | 0.55 | 0.74 |
The financial leverage and high debt ratios indicate elevated financial risk, demanding caution.
📈 Fundamental Strength & Profitability
Sharp fluctuations in profitability ratios depict challenges. Recent ROE figures switching from positive to negative over the years suggests unstable profitability.
| Year | 2023 | 2024 | 2025 |
|---|---|---|---|
| Return on Equity | 87.05% | -35.81% | -14.74% |
| Return on Assets | 1.05% | 0.96% | 0.68% |
| Net Margin | 3.36% | 2.93% | 2.09% |
| EBIT Margin | 15.07% | 15.95% | 15.35% |
| Gross Margin | 56.98% | 56.15% | 25.69% |
The erratic profitability trends indicate ongoing operational inefficiencies or risks in revenue sustainability.
📉 Price Development
✅ Dividend Scoring System
| Criteria | Score (1-5) | Score Bar |
|---|---|---|
| Dividend yield | 2 | |
| Dividend Stability | 4 | |
| Dividend Growth | 2 | |
| Payout ratio | 1 | |
| Financial Stability | 2 | |
| Dividend Continuity | 4 | |
| Cashflow Coverage | 1 | |
| Balance Sheet Quality | 2 |
Total Score: 18/40
📊 Rating
Iron Mountain Incorporated's dividend profile showcases strengths in stability and continuity, but structural weaknesses in payout ratios and cash flow coverage require caution. While it presents as a reliable payer historically, potential investors should consider risks associated with elevated leverage and weak capital efficiency.
Smart Data Insight
Master the Perfect Entry & Exit for this Stock
Don't leave your profits to chance. Historically, this stock follows specific seasonal patterns that institutional traders use to maximize returns.
- ✅ Identify the "Golden Buying Window"
- ✅ Avoid high-risk correction cycles
- ✅ Backtested data from the last 20+ years