May 09, 2026 a 03:31 am


IRM: Dividend Analysis - Iron Mountain Incorporated
Iron Mountain Incorporated presents a sturdy dividend profile with a dividend yield of 2.62%. The company has demonstrated consistent dividend payments over 17 years. However, with an unusually high EPS payout ratio, caution is advised. The five-year average dividend growth of 0.54% indicates moderate progression, potentially appealing to income-focused investors.
Overview 📊
Iron Mountain operates within a stable sector, characterized by consistent cash flows, crucial for supporting its dividend commitments even during economic fluctuations. With a current dividend yield of 2.62%, it offers a modest income stream. Maintaining 17 years of dividend history underscores reliability, although vigilance over cash flow adequacy is paramount, given prior payout challenges.
| Parameter | Value |
|---|---|
| Sector | Data Storage & Management |
| Dividend yield | 2.62% |
| Current dividend per share | $3.11 USD |
| Dividend history | 17 years |
| Last cut or suspension | None |
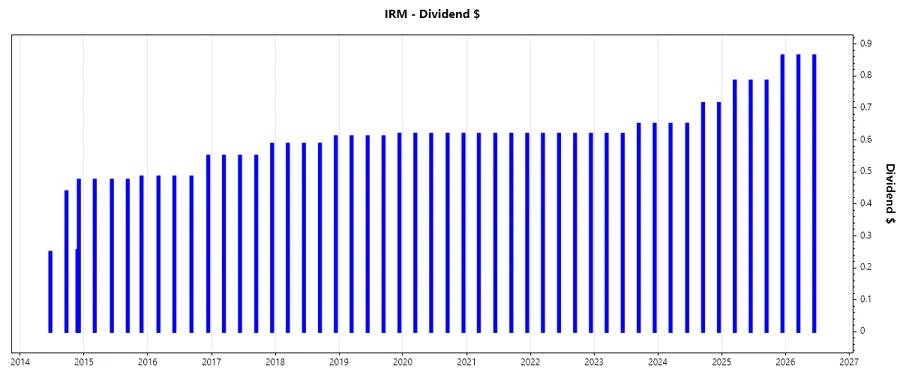
Dividend History 📈
The dividend history of Iron Mountain is indicative of strong financial health and shareholder commitment. Regular dividends for 17 years demonstrate resilience. Visualizing these payments offers insights into the firm's fiscal strategies and market confidence.
| Year | Dividend per Share (USD) |
|---|---|
| 2026 | $1.728 |
| 2025 | $3.219 |
| 2024 | $2.730 |
| 2023 | $2.537 |
| 2022 | $2.474 |
Dividend Growth 📉
Iron Mountain's dividend growth over recent years paints a mixed picture. While the five-year growth average stands at 0.54%, three-year perspectives reflect a stronger surge at 0.92%. Adequate growth suggests potential market repositioning.
| Time | Growth |
|---|---|
| 3 years | 0.92% |
| 5 years | 0.54% |
The average dividend growth is 0.54% over 5 years. This shows moderate but steady dividend growth.
Payout Ratio ✅
Analyzing payout ratios reveals critical insight into sustainability. A payout ratio based on EPS of 339.28% suggests potential unsustainability, as it exceeds net income. The FCF-based ratio of -148.23% further implies an operational deficit, reinforcing the need for caution.
| Key Figure | Ratio |
|---|---|
| EPS-based | 339.28% |
| Free cash flow-based | -148.23% |
The elevated EPS payout ratio underscores a reliance on external financial strategies. The negative FCF payout indicates urgent attention is needed in operational and pricing strategies to maintain dividend integrity.
Cashflow & Capital Efficiency
Understanding cash flow dynamics and capital efficiency provides visibility into operational robustness and resource utility, both paramount for sustaining shareholder returns.
| Metric | 2023 | 2024 | 2025 |
|---|---|---|---|
| Free Cash Flow Yield | -1.13% | -2.13% | -3.80% |
| Earnings Yield | 0.71% | 0.58% | 0.59% |
| CAPEX to Operating Cash Flow | 120.79% | 154.92% | 169.52% |
| Stock-based Compensation to Revenue | 1.97% | 1.92% | 2.03% |
| Free Cash Flow / Operating Cash Flow Ratio | -69.52% | -54.92% | -69.52% |
Iron Mountain's negative Free Cash Flow ratios reflect a challenging period, emphasizing the importance of operational restructuring. Meanwhile, CAPEX's heavy investment underscores potential for growth or technological advancement.
Balance Sheet & Leverage Analysis
Iron Mountain exhibits a complex leverage scenario, with high debt levels impacting equity. A robust understanding is essential to gauge long-term solvency and risk tolerance.
| Metric | 2023 | 2024 | 2025 |
|---|---|---|---|
| Debt-to-Equity | -69.86 | -32.54 | -19.42 |
| Debt-to-Assets | 84.63% | 87.46% | 90.18% |
| Debt-to-Capital | 98.59% | 103.17% | 105.43% |
| Net Debt to EBITDA | 83.85 | 85.01 | 90.67 |
| Current Ratio | 3.72 | 0.55 | 0.74 |
| Quick Ratio | 0.74 | 0.55 | 0.74 |
| Financial Leverage | 82.56 | 37.20 | 21.53 |
The high leverage ratios suggest significant financial obligations which could impact future profitability and flexibility. However, the strong current ratio in 2023 suggests decent liquidity for short-term liabilities.
Fundamental Strength & Profitability
Profitability metrics offer insights into a company's efficiency in using its resources. Despite challenges, Iron Mountain shows reasonable asset return and comprehensive margin profiles suggest areas of efficiency improvement.
| Metric | 2023 | 2024 | 2025 |
|---|---|---|---|
| Return on Equity | 87.05% | -35.81% | -14.74% |
| Return on Assets | 1.05% | 0.96% | 0.68% |
| Margins: Net | 3.36% | 2.93% | 2.09% |
| Margins: EBIT | 15.05% | 15.95% | 15.35% |
| Margins: EBITDA | 29.54% | 31.01% | 30.19% |
| Margins: Gross | 56.98% | 56.15% | 25.69% |
| Research & Development to Revenue | 0% | 0% | 0% |
Despite declining returns on equity and assets, Iron Mountain maintains solid EBIT and EBITDA margins, pointing towards operational effectiveness. Future growth hinges on enhancing asset returns and gross margin management.
Price Development
Dividend Scoring System 💡
| Criteria | Score | Indicator |
|---|---|---|
| Dividend yield | 3 | |
| Dividend Stability | 5 | |
| Dividend Growth | 2 | |
| Payout Ratio | 1 | |
| Financial Stability | 2 | |
| Dividend Continuity | 4 | |
| Cashflow Coverage | 2 | |
| Balance Sheet Quality | 2 |
Total Score: 21/40
Rating 🗣️
Iron Mountain exhibits a reliable dividend strategy but is shadowed by its pronounced payout ratios and leverage concerns. While operational resilience is evident via dividends history and stable margins, attention to reduced debt levels and enhanced cash flow management remains crucial for robust investor returns. Buy cautiously if diversification offsets fiscal pressures.
Smart Data Insight
Master the Perfect Entry & Exit for this Stock
Don't leave your profits to chance. Historically, this stock follows specific seasonal patterns that institutional traders use to maximize returns.
- ✅ Identify the "Golden Buying Window"
- ✅ Avoid high-risk correction cycles
- ✅ Backtested data from the last 20+ years