August 22, 2025 a 03:31 am


IRM: Dividend Analysis - Iron Mountain Incorporated
Iron Mountain Incorporated (IRM) exhibits a modest dividend yield coupled with a consistent dividend history, which spans over 16 years without any recent cuts or suspensions. However, its payout ratios, notably the EPS-based one, show an alarmingly high distribution and should be monitored closely. Despite these concerns, the steady dividend history may attract certain income-focused investors.
📊 Overview
Iron Mountain Incorporated operates within the information management services sector. Its dividend yield is slightly above the industry average at 3.39%. The company maintains its current dividend per share at approximately 2.69 USD, reflecting its commitment to return shareholder value over the last 16 years. The absence of recent dividend cuts or suspensions further solidifies its stable financial status.
| Metric | Value |
|---|---|
| Sector | Information Management Services |
| Dividend yield | 3.39% |
| Current dividend per share | 2.69 USD |
| Dividend history | 16 years |
| Last cut or suspension | None |
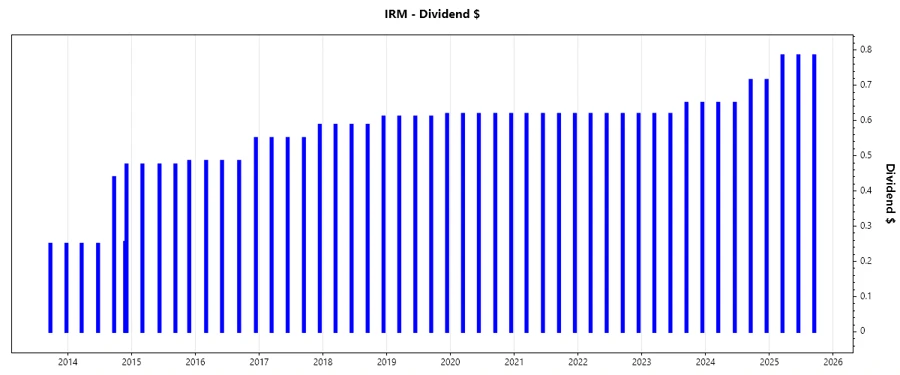
📉 Dividend History
Analyzing the history of dividend payments highlights the importance of assessing a company's commitment to consistent returns to shareholders. Iron Mountain maintains a stable dividend track record with minimal deviations over the years.
| Year | Dividend per Share (USD) |
|---|---|
| 2025 | 2.355 |
| 2024 | 2.730 |
| 2023 | 2.537 |
| 2022 | 2.474 |
| 2021 | 2.474 |
📈 Dividend Growth
Evaluating dividend growth over multiple time horizons is crucial for understanding the company's financial health and expansion capabilities. Although Iron Mountain's growth rate over the last few years reflects modest progress, it shows resilience and a potential for long-term appreciation.
| Time | Growth |
|---|---|
| 3 years | 3.34% |
| 5 years | 2.18% |
The average dividend growth is 2.18% over 5 years. This shows moderate but steady dividend growth.
✅ Payout Ratio
Payout ratios provide insights into the sustainability of dividends. Iron Mountain's excessively high EPS-based payout ratio suggests the company is paying more than it earns, which raises concerns about future dividend sustainability. Meanwhile, the negative free cash flow-based payout ratio indicates significant financial adjustments are necessary to sustain its dividend policy.
| Key Figure | Ratio |
|---|---|
| EPS-based | 1922.71% |
| Free cash flow-based | -80.24% |
These payout ratios suggest potential issues with dividend coverage, particularly the EPS-based ratio, which exceeds typical sustainable levels.
🏦 Cashflow & Capital Efficiency
Assessing cashflow metrics and capital efficiency helps determine a company's ability to cover dividends with its operating cash flow and execute strategic capital allocation. While some metrics indicate strain, particularly in free cash flow yield, the comprehensive evaluation shows tentative capital efficiency amid persistent challenges in the current financial strategy.
| Year | 2024 | 2023 | 2022 |
|---|---|---|---|
| Free Cash Flow Yield | -1.93% | -1.13% | 0.30% |
| Earnings Yield | 0.58% | 0.90% | 3.84% |
| CAPEX to Operating Cash Flow | 1.50 | 1.20 | 0.95 |
| Stock-based Compensation to Revenue | 1.92% | 1.35% | 1.11% |
| Free Cash Flow / Operating Cash Flow Ratio | -49.71% | -20.79% | 4.76% |
These metrics highlight mixed performance in cash utilization and suggest the need for strategic adjustments to enhance capital efficiency and velocity.
📉 Balance Sheet & Leverage Analysis
Balance sheet analysis provides insight into a company's financial stability and capacity to manage debt. Iron Mountain's ratios reveal a significant degree of financial leverage and prompt a necessity for reviewing its leverage strategy to uphold financial stability.
| Year | 2024 | 2023 | 2022 |
|---|---|---|---|
| Debt-to-Equity | -32.54 | 69.87 | 20.87 |
| Debt-to-Assets | 87.46% | 84.63% | 82.32% |
| Debt-to-Capital | 103.17% | 98.59% | 95.43% |
| Net Debt to EBITDA | 8.50 | 9.00 | 7.02 |
| Current Ratio | 0.55 | 0.78 | 0.81 |
| Quick Ratio | 0.55 | 0.78 | 0.81 |
| Financial Leverage | -37.20 | 82.56 | 25.35 |
These figures underscore the importance of managing leverage to sustain financial agility and safeguard financial health.
📈 Fundamental Strength & Profitability
Analyzing profitability metrics provides insight into the company's ability to generate returns on its investments. Iron Mountain exhibits fluctuations in margins and returns which necessitate focused management to streamline operations and enhance profitability.
| Year | 2024 | 2023 | 2022 |
|---|---|---|---|
| Return on Equity | -35.81% | 87.05% | 87.48% |
| Return on Assets | 0.96% | 1.05% | 3.45% |
| Return on Invested Capital | 4.55% | 4.85% | 6.40% |
| Net Margin | 2.93% | 3.36% | 10.91% |
| EBIT Margin | 15.95% | 15.07% | 22.10% |
| EBITDA Margin | 31.01% | 29.54% | 36.71% |
| Gross Margin | 56.15% | 56.98% | 57.11% |
| R&D to Revenue | 0% | 0% | 0% |
While margins remain robust, attention to return metrics and operational efficiencies will be crucial for long-term viability and shareholder value enhancement.
Price Development
🔍 Dividend Scoring System
| Category | Score (1-5) | Score Bar |
|---|---|---|
| Dividend yield | 3 | |
| Dividend Stability | 4 | |
| Dividend Growth | 2 | |
| Payout Ratio | 1 | |
| Financial Stability | 3 | |
| Dividend Continuity | 4 | |
| Cashflow Coverage | 2 | |
| Balance Sheet Quality | 2 |
Overall Score: 21/40
🗣️ Rating
The analysis of Iron Mountain Incorporated's dividend profile reflects a company with strong historical dividend stability and continuity. However, the excessively high payout ratios and leverage issues present concerns regarding future dividend sustainability. A moderate recommendation would appeal to conservative dividend investors, particularly those prioritizing consistent income with a tolerance for potential financial restructuring risks.
Smart Data Insight
Master the Perfect Entry & Exit for this Stock
Don't leave your profits to chance. Historically, this stock follows specific seasonal patterns that institutional traders use to maximize returns.
- ✅ Identify the "Golden Buying Window"
- ✅ Avoid high-risk correction cycles
- ✅ Backtested data from the last 20+ years