October 30, 2025 a 09:04 am

IQV: Trend and Support & Resistance Analysis - IQVIA Holdings Inc.
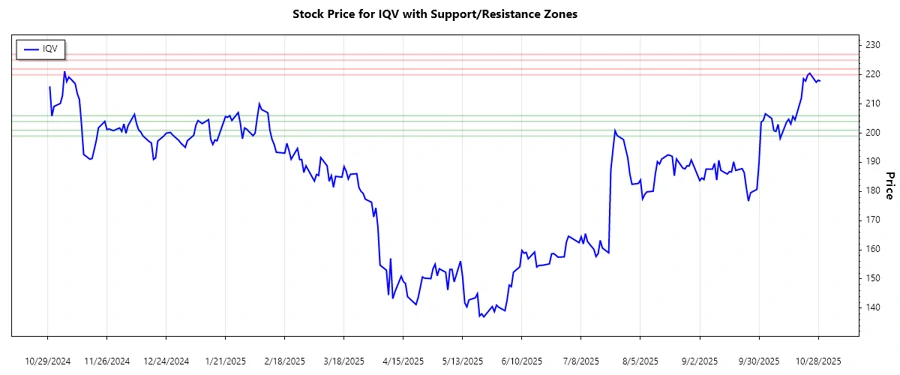
IQVIA Holdings Inc., known for its contributions in advanced analytics and clinical research services, has an interesting technical setup. Recent trends in the stock suggest dynamics that investors might consider, particularly with the convergence observed in the moving averages. This report evaluates the trends and identifies potential support and resistance levels, giving a clearer picture for potential stock movement.
Trend Analysis
The stock has shown significant movement over the past months. Calculating the Exponential Moving Averages (EMAs) for the last 20 and 50 trading days, we deduce the following:
| Date | Close Price | Trend |
|---|---|---|
| 2025-10-29 | 217.83 | ⚖️ |
| 2025-10-28 | 218.13 | ⚖️ |
| 2025-10-27 | 217.43 | ▲ |
| 2025-10-24 | 220.52 | ▲ |
| 2025-10-23 | 219.91 | ▲ |
| 2025-10-22 | 217.86 | ▲ |
| 2025-10-21 | 218.67 | ▲ |
Through analysis, the EMAs suggest a current uptrend, with the EMA20 slightly above the EMA50. This indicates a positive momentum, but the proximity to the EMA50 suggests vigilance for a potential trend reversal.
Support and Resistance
Identifying key levels of support and resistance using historical data:
| Type | Zone From | Zone To |
|---|---|---|
| Support | 204.00 | 206.00 |
| Support | 199.00 | 201.00 |
| Resistance | 220.00 | 222.00 |
| Resistance | 225.00 | 227.00 |
The current price is holding near a high resistance zone, indicating a potential challenge in breaking higher. Investors may see selling pressure if unable to surpass these levels.
Conclusion
IQVIA Holdings Inc. shows bullish technical indicators but is approaching strong resistance, suggesting caution. A breakout above resistance could confirm further uptrend potential, while failure to breach may lead to consolidation or pullback. Investors should monitor the fundamental catalysts along with these technical levels to better strategize their positions. The intersection of trends and zones in the current price range presents both opportunities and risks, typical to consider in detailed analysis.
Smart Data Insight
Master the Perfect Entry & Exit for this Stock
Don't leave your profits to chance. Historically, this stock follows specific seasonal patterns that institutional traders use to maximize returns.
- ✅ Identify the "Golden Buying Window"
- ✅ Avoid high-risk correction cycles
- ✅ Backtested data from the last 20+ years