September 27, 2025 a 03:15 pm
IQV: Fibonacci Analysis - IQVIA Holdings Inc.
IQVIA Holdings Inc., a leader in advanced analytics and technology for the life sciences, has experienced a mixed market trajectory. Recently, its stock reflects a pivotal point for potential growth or caution. As life sciences demand grows, IQVIA's diverse service portfolio could bolster future financial stability.
Fibonacci Analysis
| Details | Information |
|---|---|
| Start Date | 2024-09-30 |
| End Date | 2025-09-26 |
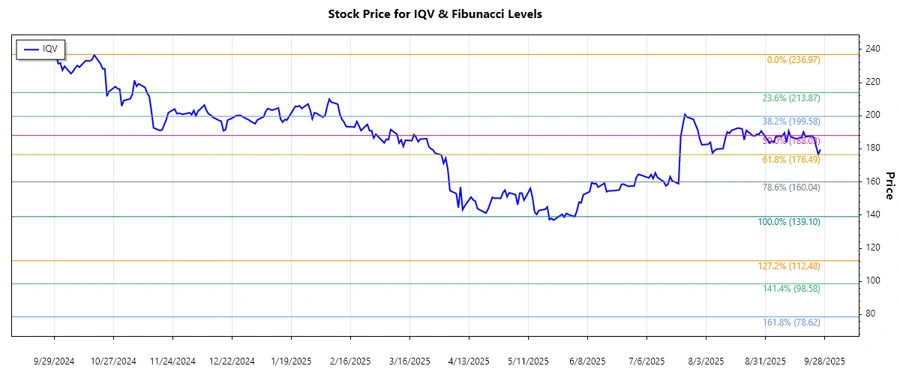
| High (Price & Date) | $236.97 on 2024-09-30 |
| Low (Price & Date) | $139.1 on 2025-06-02 |
| Fibonacci Level | Price Level |
|---|---|
| 0.236 | $161.66 |
| 0.382 | $178.44 |
| 0.5 | $188.04 |
| 0.618 | $197.64 |
| 0.786 | $211.71 |
The current price of $179.56 is within the 0.382 retracement zone, suggesting potential support at this level. Technically, this can serve as a crucial support zone, where the price might stabilize or reverse upward.
Conclusion
IQVIA Holdings Inc. offers a solid prospect in the life sciences sector with emerging opportunities from its technological solutions. The stock's current technical setup, with a potential support at the 0.382 Fibonacci level, provides an interesting entry point for investors. However, the stock remains exposed to market volatility and sector-specific risks. Analysts should consider both the robust service lines of IQVIA and external economic factors when evaluating future performance.
Smart Data Insight
Master the Perfect Entry & Exit for this Stock
Don't leave your profits to chance. Historically, this stock follows specific seasonal patterns that institutional traders use to maximize returns.
- ✅ Identify the "Golden Buying Window"
- ✅ Avoid high-risk correction cycles
- ✅ Backtested data from the last 20+ years