August 09, 2025 a 05:15 am

IQV: Fibonacci Analysis - IQVIA Holdings Inc.
IQVIA Holdings Inc., operating primarily in the life sciences industry, is a significant player offering advanced analytics, technology solutions, and clinical research services. The company's strong market position and strategic collaboration with HealthCore, Inc. indicate promising prospects. Recent market fluctuations might create trading opportunities leveraging the company's diverse service offerings and global reach.
Fibonacci Analysis
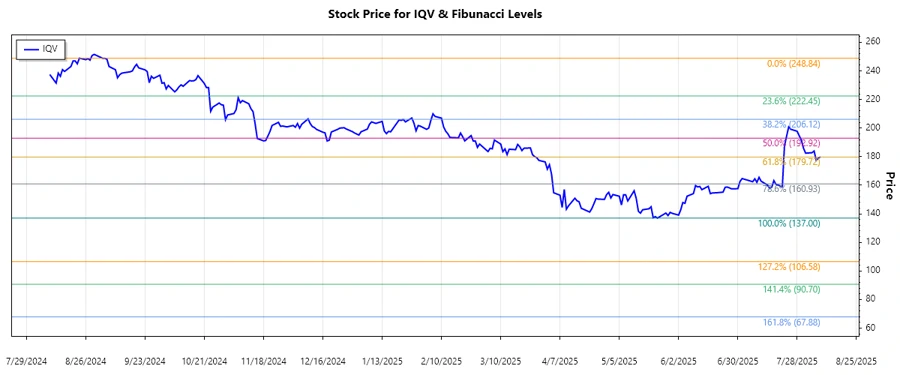
The last dominant trend observed for IQVIA Holdings Inc. (IQV) was a downtrend. The trend began in September 2024 and continued until August 2025.
| Start Date | End Date | High Price | Low Price |
|---|---|---|---|
| 2024-09-05 | 2025-08-08 | 248.84 (2024-09-04) | 137.00 (2025-05-23) |
Based on this trend, the Fibonacci Retracement Levels are calculated as follows:
| Level | Price |
|---|---|
| 0.236 | 160.29 |
| 0.382 | 177.64 |
| 0.5 | 192.92 |
| 0.618 | 208.20 |
| 0.786 | 230.48 |
The current price (179.86 on 2025-08-08) is within the 0.382 retracement level, suggesting a potential support or reversal area.
Technically, trading near the 0.382 level could signal a stabilization phase or a continuation of a corrective move upwards. This level may act as support or resistance in future price actions.
Conclusion
This analysis of IQVIA Holdings Inc. suggests that the stock is currently stabilizing after a significant downtrend. The presence in the 0.382 Fibonacci retracement zone points towards a potential area of accumulation or base building, indicating that buyers might be stepping in. However, the company's performance will heavily depend on market conditions, innovations, and strategic partnerships. Investors should closely monitor the 0.382 level, as a firm hold or break from this point could set the tone for future price movements. Overall, the current technical position indicates both opportunities for rebound and risks of continuation in a downward move.