August 30, 2025 a 06:44 am
IP: Fibonacci Analysis - International Paper Company
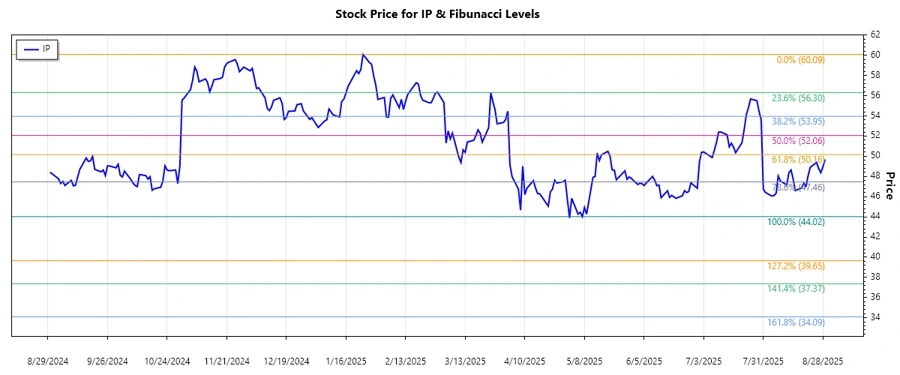
The International Paper Company has been experiencing a recent price decline, with a dominant downtrend identified in the past several months. This downturn could be attributed to factors affecting the broader market or specific challenges within the packaging and cellulose segments. As the prices have been falling, it is critical to determine potential retracement levels where the stock might find support and possibly reverse. Let's delve into the Fibonacci retracement levels to uncover key price points that investors should watch.
Fibonacci Analysis
| Metric | Details |
|---|---|
| Trend Start Date | 2024-11-25 |
| Trend End Date | 2025-08-29 |
| High Point | $60.09 on 2025-01-24 |
| Low Point | $44.02 on 2025-05-07 |
| Current Price | $49.68 |
| Fibonacci Level 0.236 | $47.61 |
| Fibonacci Level 0.382 | $49.07 |
| Fibonacci Level 0.5 | $50.06 |
| Fibonacci Level 0.618 | $51.05 |
| Fibonacci Level 0.786 | $52.64 |
| Retracement Zone | 0.236 |
The current price is situated within the 0.236 retracement level. This may suggest the potential for a continued support level, likely attracting buyers if the price maintains above this Fibonacci level.
Technically, the Fibonacci levels indicate potential support areas. If prices hold above the 0.236 level, it might suggest a consolidation phase before a possible trend reversal. Conversely, a breakdown below this level could indicate sustained bearish momentum.
Conclusion
The International Paper Company is currently experiencing a downtrend, moving through critical Fibonacci retracement levels indicating potential support regions. While the stock price is within the 0.236 retracement zone, suggesting a potential consolidation phase, there remains uncertainty. Analysts should be cautious, observing whether support at this level holds or if further downward pressure can break below it. Potential risks include market volatility and segment-specific challenges. Notwithstanding, those levels act as strategic points for technical analysts aiming to speculate on reversals or continuations based on broader market cues.
Smart Data Insight
Master the Perfect Entry & Exit for this Stock
Don't leave your profits to chance. Historically, this stock follows specific seasonal patterns that institutional traders use to maximize returns.
- ✅ Identify the "Golden Buying Window"
- ✅ Avoid high-risk correction cycles
- ✅ Backtested data from the last 20+ years