April 08, 2026 a 07:46 am
IP: Dividend Analysis - International Paper Company
The International Paper Company stands out for its enduring dividend legacy, supporting shareholder returns with a consistent yield. However, the negative payout ratios signal potential challenges, necessitating careful observation of its financial foundation going forward.
📊 Overview
International Paper operates within the Materials sector and manifests a dividend yield of 4.17%. With a current dividend per share standing at $1.85 and a robust history spanning 57 years without recent reductions, it reflects a reliable dividend track record.
| Attribute | Value |
|---|---|
| Sector | Materials |
| Dividend yield | 4.17% |
| Current dividend per share | 1.85 USD |
| Dividend history | 57 years |
| Last cut or suspension | None |
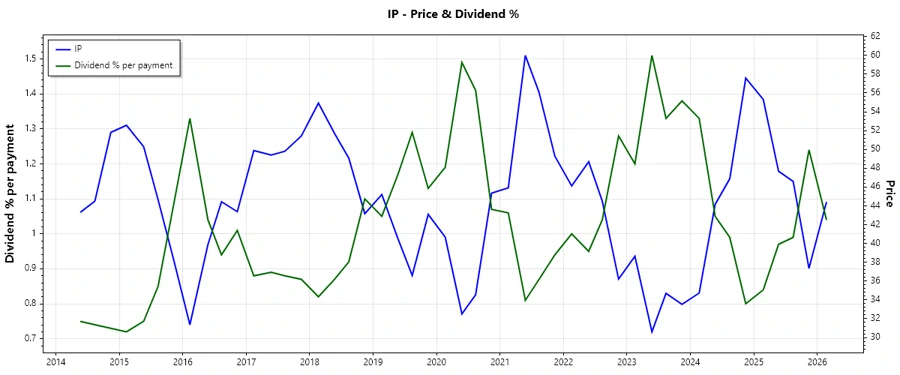
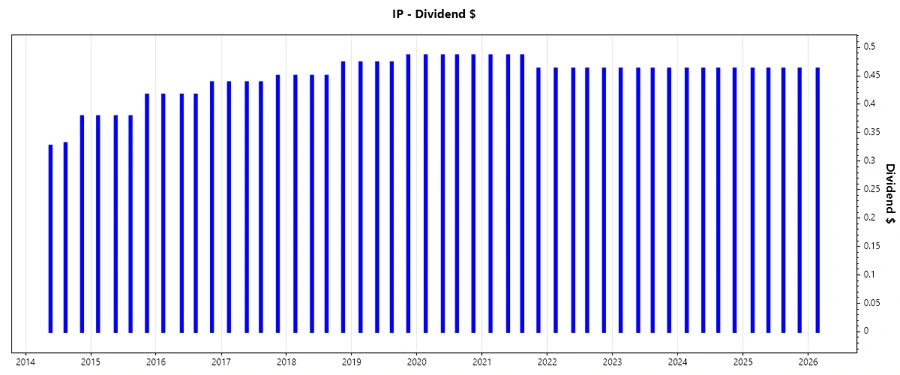
📈 Dividend History
The dividend history of International Paper reveals strong longevity, imperative for investor confidence. A consistent payout signals effectively managed earnings and cash flows, crucial for investment attractiveness over the long term.
| Year | Dividend per Share (USD) |
|---|---|
| 2026 | 0.4625 |
| 2025 | 1.8500 |
| 2024 | 1.8500 |
| 2023 | 1.8500 |
| 2022 | 1.8500 |
📉 Dividend Growth
Dividend growth reflects a company's capacity to sustainably increase shareholder returns. Despite a 5-year decrease of -0.98%, the long-term focus could drive positive trends.
| Time | Growth |
|---|---|
| 3 years | 0% |
| 5 years | -0.98% |
The average dividend growth is -0.98% over 5 years. This shows moderate but steady dividend growth.
✅ Payout Ratio
Payout ratios assess the sustainability of dividend distributions. EPS-based ratio at -27.79% and FCF-based at -616.17% raise concerns about dividend coverage and profitability sustainability.
| Key Figure | Ratio |
|---|---|
| EPS-based | -27.79% |
| Free cash flow-based | -616.17% |
These negative figures highlight underlying operational difficulties that could challenge ongoing dividend payments unless rectified.
📊 Cashflow & Capital Efficiency
Analyzing cash flow metrics provides insights into a firm's financial health and capital efficiency. Free cash flow yield and earnings yield are pivotal for assessing the firm's ability to fund dividends, reinvest, and reduce debt.
| Metric | 2023 | 2024 | 2025 |
|---|---|---|---|
| Free Cash Flow Yield | 5.52% | 4.05% | -0.76% |
| Earnings Yield | 2.41% | 2.98% | -16.91% |
| CAPEX to Operating Cash Flow | 6.22% | 5.49% | 10.94% |
| Stock-based Compensation to Revenue | 0.31% | 0.44% | 0% |
| Free Cash Flow / Operating Cash Flow Ratio | 37.75% | 45.11% | -9.36% |
| Return on Invested Capital | 5.11% | 2.54% | -7.64% |
Variability in cash flow metrics indicates potential instability, necessitating vigilance in capital management and reinvestment strategies.
🗣️ Balance Sheet & Leverage Analysis
Key metrics like the debt-to-equity ratio and current ratio evaluate a firm's leverage & liquidity. These are essential in determining financial stability and risk profile.
| Metric | 2023 | 2024 | 2025 |
|---|---|---|---|
| Debt-to-Equity | 0.71 | 0.72 | 0.73 |
| Debt-to-Assets | 25.39% | 25.67% | 28.46% |
| Debt-to-Capital | 41.41% | 41.73% | 42.15% |
| Net Debt to EBITDA | 2.11 | 2.49 | -74.29 |
| Current Ratio | 1.67 | 1.51 | 1.28 |
| Quick Ratio | 1.19 | 1.09 | 1.02 |
| Financial Leverage | 2.784 | 2.79 | 2.56 |
The analysis suggests cautious management in liquidity and leverage as interest coverage ratios reveal constraints amid adversity.
✅ Fundamental Strength & Profitability
Profitability metrics like return on equity and net margins evaluate operational success and investor returns.
| Metric | 2023 | 2024 | 2025 |
|---|---|---|---|
| Return on Equity | 3.61% | 6.82% | -23.71% |
| Return on Assets | 1.30% | 2.44% | -9.26% |
| Net Margin | 1.60% | 2.99% | -14.12% |
| EBIT Margin | 4.25% | 3.10% | -11.97% |
| EBITDA Margin | 12.01% | 10.11% | -0.55% |
| Gross Margin | 20.38% | 28.16% | 29.53% |
| R&D to Revenue | 0% | 0% | 0% |
Mixed results in core profitability metrics suggest tactical adjustments are needed to enhance long-term viability and value generation.
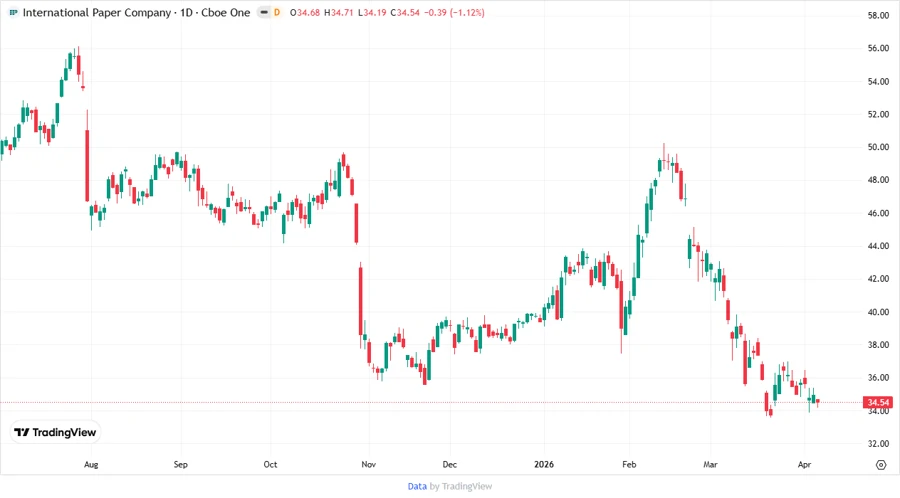
📊 Price Development
🎯 Dividend Scoring System
| Criterion | Score | Score Bar |
|---|---|---|
| Dividend yield | 4 | |
| Dividend Stability | 5 | |
| Dividend growth | 2 | |
| Payout ratio | 1 | |
| Financial stability | 2 | |
| Dividend continuity | 4 | |
| Cashflow Coverage | 1 | |
| Balance Sheet Quality | 2 |
Total Score: 21/40
🗣️ Rating
In conclusion, the fluctuation in performance and financial ratios of International Paper raise caution for prospective income-seeking investors. While dividend stability and a commendable historical record offer some reassurance, the underlying financial metrics suggest vigilance as core operational improvements are needed to secure sustained investor returns.
Smart Data Insight
Master the Perfect Entry & Exit for this Stock
Don't leave your profits to chance. Historically, this stock follows specific seasonal patterns that institutional traders use to maximize returns.
- ✅ Identify the "Golden Buying Window"
- ✅ Avoid high-risk correction cycles
- ✅ Backtested data from the last 20+ years