January 03, 2026 a 07:31 am
IP: Dividend Analysis - International Paper Company
International Paper Company has demonstrated a resilient dividend history with over 56 years of payments. Despite a recent cut in 2022, the company maintains a robust yield. As it navigates the challenging financial landscape, its commitment to returning value to shareholders remains evident.
📊 Overview
The International Paper Company, a stalwart in the Materials sector, offers a dividend yield of 4.95%. With consistent dividends over 56 years, the current dividend per share stands at 1.85 USD. The last adjustment occurred in 2022, reflecting the company's adaptive strategies in a volatile market.
| Metric | Value |
|---|---|
| Sector | Materials |
| Dividend yield | 4.95% |
| Current dividend per share | 1.85 USD |
| Dividend history | 56 years |
| Last cut or suspension | 2022 |
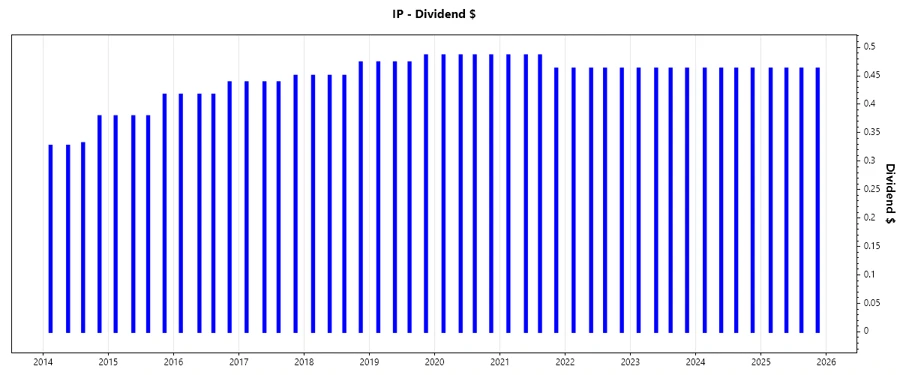
🗣️ Dividend History
Consistency is key for dividend investors, and International Paper Company's history underscores a tradition of shareholder returns. Understanding past dividend actions provides insight into the company's sustainability efforts and commitment to its dividend policy.
| Year | Dividend per Share |
|---|---|
| 2025 | 1.85 USD |
| 2024 | 1.85 USD |
| 2023 | 1.85 USD |
| 2022 | 1.85 USD |
| 2021 | 1.92 USD |
📈 Dividend Growth
Dividend growth reflects a company's potential for increased future payments. While International Paper's 5-year growth is slightly negative at -0.01%, maintaining a stable dividend in tough conditions showcases resilience.
| Time | Growth |
|---|---|
| 3 years | 0% |
| 5 years | -0.98% |
The average dividend growth is -0.98% over 5 years. This shows moderate but steady dividend growth amidst economic headwinds.
⚠️ Payout Ratio
Payout ratios offer insights into dividend sustainability. However, negative EPS (-76.45%) and FCF-based (-353.03%) payout ratios indicate that International Paper needs to enhance profitability and cash flow coverage to maintain its dividend in the long term.
| Key figure ratio | Percentage |
|---|---|
| EPS-based | -76.45% |
| Free cash flow-based | -353.03% |
The company's payout ratios highlight risks, pointing to high pressure on earnings and cash flows to support dividends sustainably.
Cashflow & Capital Efficiency
Cashflow efficiency is pivotal for fiscal health. Despite a recent history of deficits in Free Cash Flow Yield (-1.30%) and Earnings Yield (-6.02%), it demonstrates the potential to stabilize cash flows by optimizing capital use.
| Metric | 2024 | 2023 | 2022 |
|---|---|---|---|
| Free Cash Flow Yield | 4.05% | 5.52% | 9.88% |
| Earnings Yield | 2.98% | 2.41% | 11.95% |
| CAPEX to Operating Cash Flow | 54.89% | 62.25% | 42.82% |
| Stock-based Compensation to Revenue | 0.44% | 0.31% | 0.59% |
| Free Cash Flow / Operating Cash Flow Ratio | 45.11% | 37.75% | 57.18% |
Current figures suggest a really high cost on CAPEX, this translates to needs for efficient capital allocation and strategic investments. Continual improvements in this area are necessary to bolster cash flow security.
Balance Sheet & Leverage Analysis
The balance sheet ratios of International Paper highlight vital areas for maintaining corporate stability. Despite a Debt-to-Equity ratio of 0.716 and a moderate Current Ratio of 1.313, the company's financial leverage emphasizes the need for prudent debt management.
| Metric | 2024 | 2023 | 2022 |
|---|---|---|---|
| Debt-to-Equity | 0.716 | 0.707 | 0.690 |
| Debt-to-Assets | 0.257 | 0.254 | 0.245 |
| Debt-to-Capital | 0.417 | 0.414 | 0.408 |
| Net Debt to EBITDA | 2.49 | 2.11 | 1.71 |
| Current Ratio | 1.313 | 1.669 | 1.354 |
| Quick Ratio | 1.090 | 1.192 | 0.966 |
| Financial Leverage | 2.79 | 2.78 | 2.82 |
These indicators suggest solid liquidity but call for improved logistical coordination on debt usage for optimal financial health.
Fundamental Strength & Profitability
The effectiveness of International Paper in converting revenues into profit and returns is critical. Recent returns on equity and assets have improved but remain relatively low, necessitating intensified operational focus.
| Metric | 2024 | 2023 | 2022 |
|---|---|---|---|
| Return on Equity | 6.82% | 3.61% | 17.70% |
| Return on Assets | 2.44% | 1.30% | 6.28% |
| Margins: Net | 2.99% | 1.60% | 7.11% |
| Margins: EBIT | 3.10% | 4.25% | 9.04% |
| Margins: EBITDA | 10.11% | 12.01% | 13.96% |
| Margins: Gross | 28.16% | 20.38% | 28.44% |
| R&D to Revenue | 0% | 0% | 0% |
The company's fundamental strength signals a need for strategic improvements in profitability. Laboring towards higher operational efficiency remains a priority.
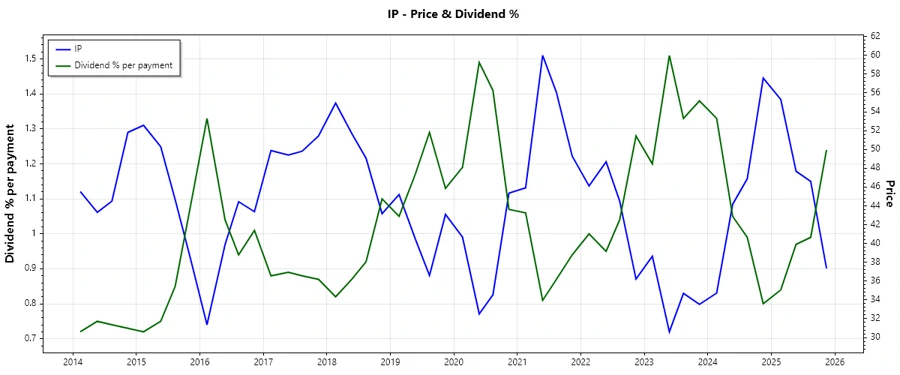
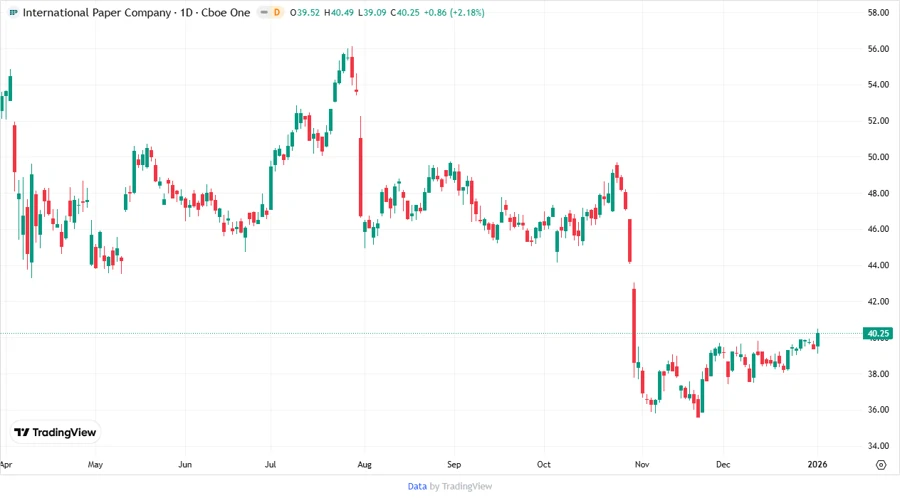
Price Development
Dividend Scoring System
| Criteria | Score | Score Bar |
|---|---|---|
| Dividend yield | 4 | |
| Dividend Stability | 3 | |
| Dividend growth | 2 | |
| Payout ratio | 1 | |
| Financial stability | 4 | |
| Dividend continuity | 4 | |
| Cashflow Coverage | 2 | |
| Balance Sheet Quality | 3 |
Total Score: 23/40
✅ Rating
International Paper Company presents a complex financial profile with robust dividend history but constrained growth and payout metrics. Investors may find the current dividend yield attractive, yet prudence is advised given the current challenging financial conditions, highlighting a hold strategy pending operational improvements.