September 21, 2025 a 02:47 am
📊 Dividend Analysis - International Paper Company
The International Paper Company (IP), with a robust market capitalization of $24.51 billion, exhibits a steady dividend history, maintaining payouts for 56 years. Despite a relatively high dividend yield of approximately 4%, recent EPS and free cash flow payout ratios suggest caution, indicative of the company's challenges in profit generation.
📊 Overview
The fundamental assessment of International Paper's dividend profile reflects its position within the materials sector, historically resilient over 56 years of continued dividend payments. However, the recent EPS payout ratio raised concerns over potential sustainability without strategic operational improvements.
| Sector | Dividend Yield | Current Dividend per Share | Dividend History | Last Cut or Suspension |
|---|---|---|---|---|
| Materials | 3.97% | $1.85 | 56 years | None |
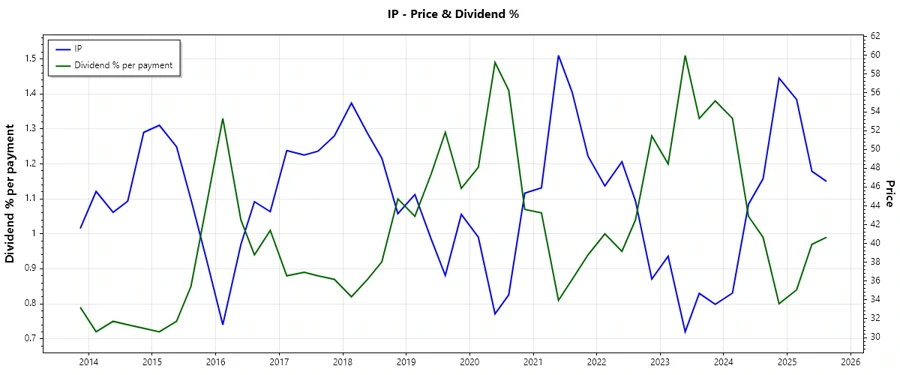
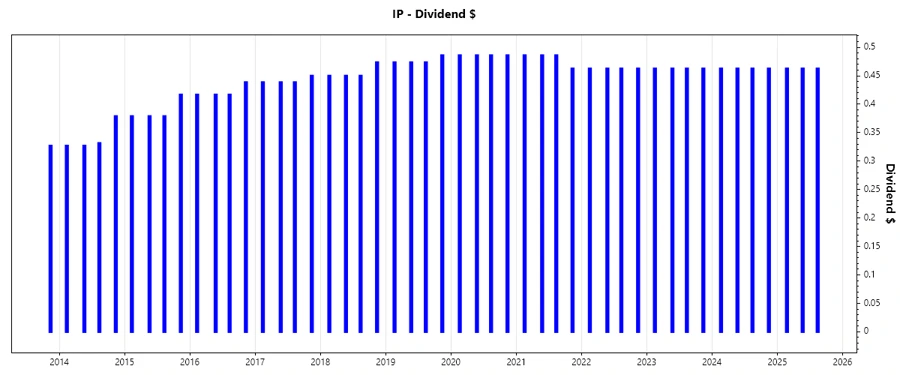
📈 Dividend History
With over five decades of uninterrupted dividends, International Paper's dividend history is a testament to its stable shareholder remuneration strategy. However, it's essential to factor in the historical context of earnings and market conditions, which have influenced past adjustments.
| Year | Dividend per Share (USD) |
|---|---|
| 2025 | 1.3875 |
| 2024 | 1.8500 |
| 2023 | 1.8500 |
| 2022 | 1.8500 |
| 2021 | 1.9199 |
📈 Dividend Growth
The dividend growth trend over the past few years indicates a challenging environment for IP, marked by negative growth rates. Consistently negative figures highlight the need for strategic innovation and capital allocation improvements.
| Time | Growth |
|---|---|
| 3 years | -1.23% |
| 5 years | -0.60% |
The average dividend growth is -0.60% over 5 years. This shows moderate but steady dividend reductions, suggesting potential underlying challenges in sustaining prior dividend levels.
📈 Payout Ratio
Evaluating the payout ratios provides crucial insights into the dividend sustainability and overall financial health of IP. High negative ratios can signify an inability to cover dividends from profits, raising potential red flags.
| Key figure | Ratio |
|---|---|
| EPS-based | -3621% |
| Free cash flow-based | -829% |
With an EPS payout ratio of -3621% and an FCF payout ratio of -829%, IP's current coverage suggests significant challenges in profit translation to support dividend distributions. Strategic financial revisions may be crucial to sustain current yield levels.
📊 Cashflow & Capital Efficiency
Cash flow and capital efficiency statistics are vital to understand IP's operational vitality. Reflecting on negative free cash flow yield and high capital investment, IP's ability to maintain operating efficiency and shareholder value requires scrutiny.
| Year | Free Cash Flow Yield | Earnings Yield | CAPEX to Operating Cash Flow | Stock-based Compensation to Revenue | Free Cash Flow / Operating Cash Flow Ratio |
|---|---|---|---|---|---|
| 2024 | 4.05% | 2.98% | 54.89% | 0.44% | 0.45 |
| 2023 | 5.52% | 2.30% | 62.25% | 0.31% | 0.38 |
| 2022 | 9.88% | 11.95% | 42.82% | 0.59% | 0.57 |
IP's cash flow stability and capital efficiency metrics depict a complex financial landscape necessitating extensive cash management. Optimizing CAPEX and enhancing revenue generation remain pivotal for improving returns.
📈 Balance Sheet & Leverage Analysis
Analyzing the balance sheet and leverage ratios provides key insights into IP's financial resilience and debt management strategy crucial for long-term viability and investor confidence.
| Year | Debt-to-Equity | Debt-to-Assets | Debt-to-Capital | Net Debt to EBITDA | Current Ratio | Quick Ratio | Financial Leverage |
|---|---|---|---|---|---|---|---|
| 2024 | 0.716 | 0.2567 | 0.4173 | 2.49 | 1.51 | 1.09 | 2.79 |
| 2023 | 0.707 | 0.2539 | 0.4141 | 2.14 | 1.67 | 1.19 | 2.78 |
| 2022 | 0.690 | 0.2449 | 0.4082 | 1.71 | 1.35 | 0.97 | 2.82 |
The leverage and liquidity indicators highlight IP's balance sheet strengths and vulnerabilities, notably in debt management capacity, signaling the need for optimized financial structuring to uphold solvency thresholds.
📈 Fundamental Strength & Profitability
Fundamental strength assessments, focusing on profitability and operational efficiencies, provide a comprehensive overview of IP's competitive positioning and revenue-generating capabilities.
| Year | Return on Equity | Return on Assets | Margins - Net | Margins - EBIT | Margins - EBITDA | Margins - Gross | R&D to Revenue |
|---|---|---|---|---|---|---|---|
| 2024 | 6.82% | 2.44% | 2.99% | 3.10% | 10.11% | 28.16% | 0.00% |
| 2023 | 3.45% | 1.24% | 1.52% | 4.25% | 11.82% | 27.95% | 0.00% |
| 2022 | 17.70% | 6.28% | 7.11% | 9.04% | 13.96% | 28.44% | 0.00% |
IP's return ratios and margin profiles reveal fluctuating profit boundaries. By sharpening strategic R&D investments, there's potential for propelling margins and enhancing market share.
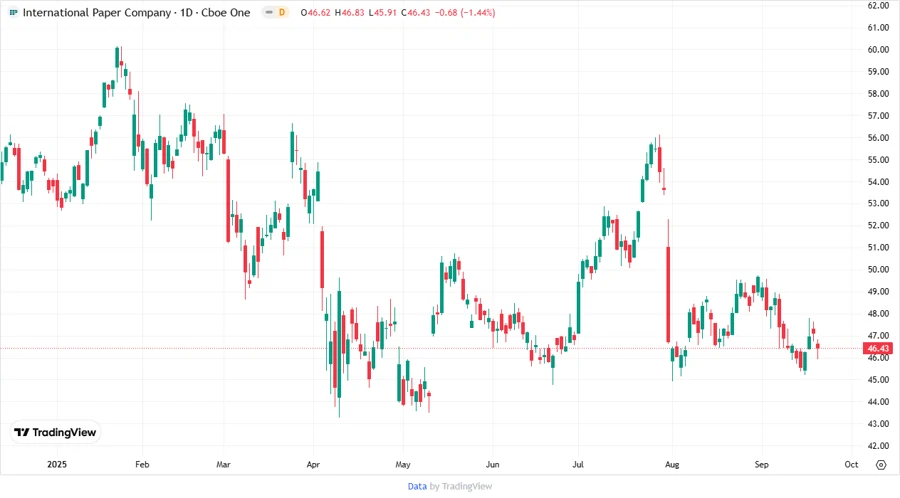
📈 Price Development
🔢 Dividend Scoring System
| Criterion | Score (out of 5) | Bar |
|---|---|---|
| Dividend yield | 3 | |
| Dividend Stability | 4 | |
| Dividend growth | 2 | |
| Payout ratio | 1 | |
| Financial stability | 3 | |
| Dividend continuity | 5 | |
| Cashflow Coverage | 2 | |
| Balance Sheet Quality | 3 |
Overall Score: 23/40
✅ Rating
In summary, International Paper Company exhibits a firm legacy in dividend distributions with evident pressure in sustaining future growth amidst its current financial posture. Strategic financial management and operational efficiencies will be essential for long-term investor value, meriting a hold recommendation for cautious dividend investors.
Smart Data Insight
Master the Perfect Entry & Exit for this Stock
Don't leave your profits to chance. Historically, this stock follows specific seasonal patterns that institutional traders use to maximize returns.
- ✅ Identify the "Golden Buying Window"
- ✅ Avoid high-risk correction cycles
- ✅ Backtested data from the last 20+ years