August 21, 2025 a 03:32 am

📊 Dividend Analysis - International Paper Company
International Paper Company (IP) demonstrates a commendable commitment to shareholders with a substantial dividend history. Despite facing profit sustainability challenges, evident from its payout ratios, the company maintains a competitive dividend yield of nearly 4%. Constancy in dividends for 56 years highlights resilience, yet the strategic need is apparent to sustain this legacy amid fluctuating earnings.
Overview
International Paper, a stalwart in the paper products sector, offers investors an attractive dividend yield of 3.97%. The consistent dividend payments over a time span of 56 years, without any recent cuts, underscore a robust commitment to returning value to shareholders. Despite headwinds, such as fluctuating dividend growth dynamics, the firm has maintained consistent payouts.
| Attribute | Details |
|---|---|
| Sector | Paper Products |
| Dividend yield | 3.97 % |
| Current dividend per share | 1.85 USD |
| Dividend history | 56 years |
| Last cut or suspension | None |
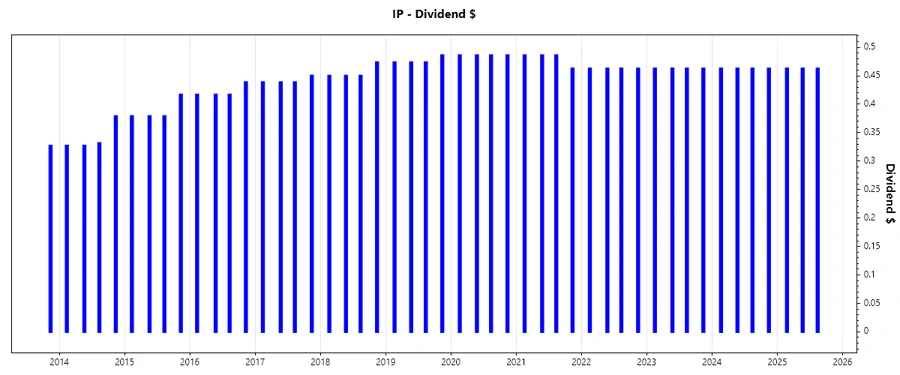
Dividend History
International Paper's long-standing tradition of paying dividends is a testament to its financial discipline and value-sharing ethos. The consistent payouts over several decades provide reassurance to income-focused investors. However, the stagnancy in growth signifies a potential need for strategic adjustments to enhance shareholder value.
| Year | Dividend per Share (USD) |
|---|---|
| 2025 | 1.3875 |
| 2024 | 1.8500 |
| 2023 | 1.8500 |
| 2022 | 1.8500 |
| 2021 | 1.9199 |
Dividend Growth
The growth history over the last 3 to 5 years shows a slight dip in dividends, presenting challenges in maintaining growth. However, it's critical for maintaining long-term investor confidence and aligns with industry standards.
| Time | Growth |
|---|---|
| 3 years | -1.23 % |
| 5 years | -0.60 % |
The average dividend growth is -0.60% over 5 years. This shows moderate but steady dividend growth in spite of economic challenges.
Payout Ratio
Payout ratios offer insights into dividend sustainability and potential for future growth. Elevated payout ratios could signal earnings distress or aggressive shareholder returns.
| Key figure ratio | Value |
|---|---|
| EPS-based | -3653.16 % |
| Free cash flow-based | -828.64 % |
The negative EPS-based and FCF-based payout ratios highlight significant financial challenges. International Paper needs operational adjustments and cost-management strategies to achieve a sustainable dividend policy.
Cashflow & Capital Efficiency
Cash flow metrics evaluate operational efficiency and financial health. Ensuring positive free cash flow and optimizing capital expenditures is essential for sustained dividend payments and growth generation.
| Metric | 2024 | 2023 | 2022 |
|---|---|---|---|
| Free Cash Flow Yield | 4.05 % | 5.52 % | 9.87 % |
| Earnings Yield | 2.98 % | 2.30 % | 11.95 % |
| CAPEX to Operating Cash Flow | 54.89 % | 62.25 % | 42.82 % |
| Stock-based Compensation to Revenue | 0.44 % | 0.31 % | 0.59 % |
| Free Cash Flow / Operating Cash Flow Ratio | 45.11 % | 37.75 % | 57.18 % |
Despite a challenging environment, maintaining sufficient cash flow and capital efficiency are pivotal for supporting dividends and growth endeavors. Continued improvements in operational cash flow coverage could strengthen financial resilience.
Balance Sheet & Leverage Analysis
A strong balance sheet with effective leverage management mitigates risks. Maintaining healthy ratios supports the enterprise's ability to meet its obligations.
| Metric | 2024 | 2023 | 2022 |
|---|---|---|---|
| Debt-to-Equity | 71.61 % | 70.68 % | 68.99 % |
| Debt-to-Assets | 25.67 % | 25.39 % | 24.49 % |
| Debt-to-Capital | 41.73 % | 41.41 % | 40.82 % |
| Net Debt to EBITDA | 2.49 | 2.14 | 1.71 |
| Current Ratio | 1.51 | 1.67 | 1.35 |
| Quick Ratio | 1.08 | 1.19 | 0.97 |
| Financial Leverage | 2.79 | 2.78 | 2.82 |
Balance sheet ratios indicate stable but cautious management of leverage. Improving these figures will boost confidence in financial stability and debt repayment capabilities.
Fundamental Strength & Profitability
Analyzing profitability metrics sheds light on the efficiency and competitiveness of operations. The ability to maintain attractive margin ratios is critical.
| Metric | 2024 | 2023 | 2022 |
|---|---|---|---|
| Return on Equity | 6.82 % | 3.45 % | 17.70 % |
| Return on Assets | 2.44 % | 1.24 % | 6.28 % |
| Margins: Net | 2.99 % | 1.52 % | 7.11 % |
| EBIT | 3.10 % | 4.25 % | 9.05 % |
| EBITDA | 10.11 % | 11.82 % | 13.96 % |
| Research & Development to Revenue | 0.00 % | 0.00 % | 0.00 % |
Despite moderate profitability metrics, focusing on operational efficiencies can lead to improved margin stability and higher profitability.
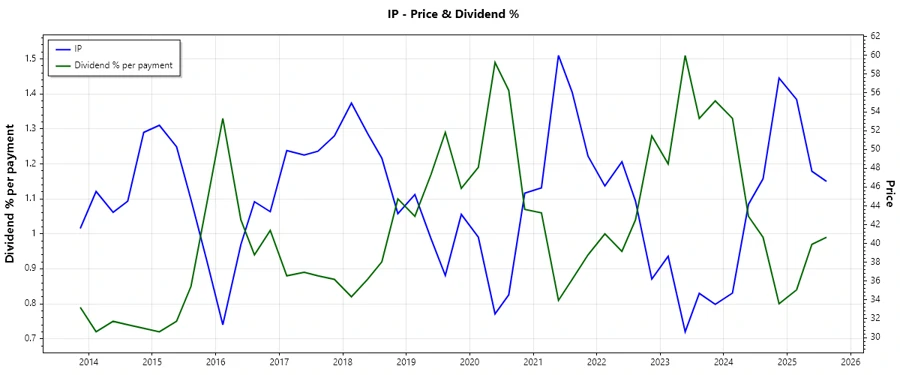
Price Development
Dividend Scoring System
| Category | Score | Score Bar |
|---|---|---|
| Dividend yield | 4 | |
| Dividend Stability | 5 | |
| Dividend growth | 2 | |
| Payout ratio | 1 | |
| Financial stability | 3 | |
| Dividend continuity | 5 | |
| Cashflow Coverage | 3 | |
| Balance Sheet Quality | 3 |
Total Score: 26/40
Rating
🗣️ Despite challenges in payout ratios and growth prospects, International Paper remains an appealing dividend stock for income-focused portfolios. However, improvements in profitability and cash flow management are crucial to sustaining future dividend increases and ensuring long-term shareholder value.
Smart Data Insight
Master the Perfect Entry & Exit for this Stock
Don't leave your profits to chance. Historically, this stock follows specific seasonal patterns that institutional traders use to maximize returns.
- ✅ Identify the "Golden Buying Window"
- ✅ Avoid high-risk correction cycles
- ✅ Backtested data from the last 20+ years