July 30, 2025 a 03:31 am
IP: Dividend Analysis - International Paper Company
The dividend profile of International Paper Company suggests a long-standing commitment to shareholder returns. With a legacy of 56 years of consistent dividend payments, it exemplifies reliability. However, recent metrics indicate potential volatility, urging caution in future performance evaluation.
📊 Overview
International Paper Company has demonstrated a strong historical commitment to dividends, complemented by its sector performance. The data reveals a compelling dividend yield, though the last cut or suspension offers insight into potential stability issues.
| Metric | Value |
|---|---|
| Sector | Paper & Packaging |
| Dividend yield | 3.40 % |
| Current dividend per share | 1.85 USD |
| Dividend history | 56 years |
| Last cut or suspension | None |
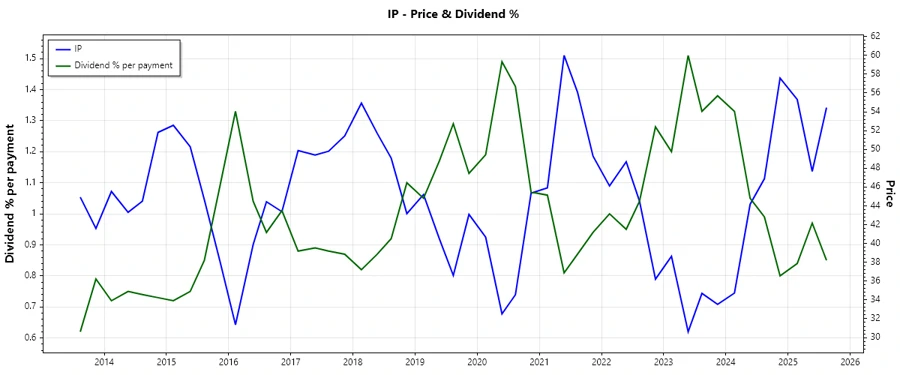
🗣️ Dividend History
International Paper's extensive dividend history showcases its commitment to consistent shareholder remuneration. Historical payouts show resilience, yet vigilance is required as past is not always prologue.
| Year | Dividend Per Share (USD) |
|---|---|
| 2025 | 1.3875 |
| 2024 | 1.8500 |
| 2023 | 1.8500 |
| 2022 | 1.8500 |
| 2021 | 1.9199 |
📈 Dividend Growth
Dividend growth is vital for assessing a company’s potential to increase payouts. Despite fluctuations, the historical average suggests a cautious optimism regarding growth prospects.
| Time | Growth |
|---|---|
| 3 years | -1.23 % |
| 5 years | -0.60 % |
The average dividend growth is -0.60 % over 5 years. This shows moderate but steady dividend growth.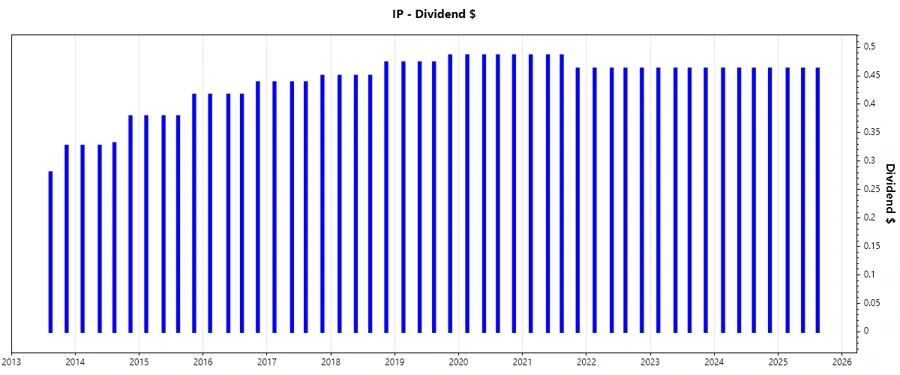
⚠️ Payout Ratio
Payout ratios offer insight into dividend sustainability. The EPS-based payout ratios reflect elevated levels, potentially questioning dividend coverage.
| Key figure | Ratio |
|---|---|
| EPS-based | 204.14 % |
| Free Cash Flow-based | -19553.05 % |
Such high EPS and negative FCF percentages suggest risks over dividend payment sustainability. Evaluating these figures, it's essential to consider implications for future payouts.
🌊 Cashflow & Capital Efficiency
Cashflow efficiency is critical for assessing a company's capacity to cover its dividends and invest for growth.
| Metric | 2024 | 2023 | 2022 |
|---|---|---|---|
| Free Cash Flow Yield | 4.05 % | 5.52 % | 9.87 % |
| Earnings Yield | 2.98 % | 2.30 % | 11.95 % |
| CAPEX to Operating Cash Flow | 54.89 % | 62.25 % | 42.82 % |
| Stock-based Compensation to Revenue | 0.00 % | 0.31 % | 0.59 % |
| Free Cash Flow / Operating Cash Flow Ratio | 45.11 % | 37.75 % | 57.18 % |
The stability of cashflow remains challenged, with fluctuations indicating potential volatility in future dividend coverage.
💡 Balance Sheet & Leverage Analysis
Understanding leverage and balance sheet strength aids in gauging financial flexibility. Healthy ratios denote robust financials, while others may signal stress.
| Metric | 2024 | 2023 | 2022 |
|---|---|---|---|
| Debt-to-Equity | 0.7161 | 0.7068 | 0.6899 |
| Debt-to-Assets | 0.2567 | 0.2539 | 0.2449 |
| Debt-to-Capital | 0.4173 | 0.4141 | 0.4082 |
| Net Debt to EBITDA | 2.49 | 2.14 | 1.71 |
| Current Ratio | 1.3291 | 1.6691 | 1.3540 |
| Quick Ratio | 1.0897 | 1.1920 | 0.9656 |
| Financial Leverage | 2.7897 | 2.7841 | 2.8175 |
The analyses suggest cautious optimism as low leverage ratios and healthy quick ratios reflect balanced financial obligations and liquidity.
🔍 Fundamental Strength & Profitability
A company's profitability and efficiency metrics provide insight into operational performance.
| Metric | 2024 | 2023 | 2022 |
|---|---|---|---|
| Return on Equity | 6.81 % | 3.45 % | 17.70 % |
| Return on Assets | 2.44 % | 1.24 % | 6.28 % |
| Net Margin | 2.99 % | 1.52 % | 7.11 % |
| EBIT Margin | 3.10 % | 4.25 % | 9.04 % |
| EBITDA Margin | 10.11 % | 11.82 % | 13.96 % |
| Gross Margin | 28.16 % | 27.95 % | 28.44 % |
| R&D to Revenue | 0.00 % | 0.00 % | 0.00 % |
IP’s fundamental strength indicators highlight considerable performance discrepancies despite overall profitability, urging comprehensive examination.
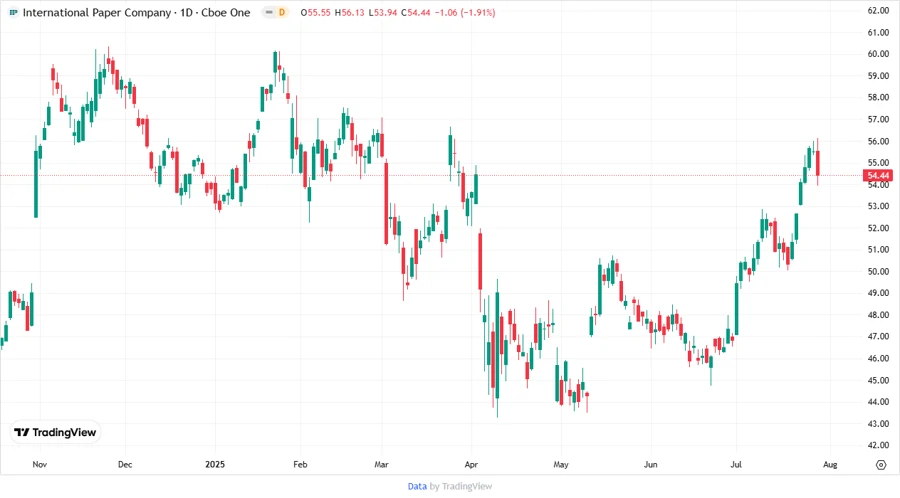
📉 Price Development
✅ Dividend Scoring System
| Criteria | Score | Score Bar |
|---|---|---|
| Dividend yield | 4 | |
| Dividend Stability | 3 | |
| Dividend growth | 2 | |
| Payout ratio | 2 | |
| Financial stability | 3 | |
| Dividend continuity | 5 | |
| Cashflow Coverage | 2 | |
| Balance Sheet Quality | 4 |
Total Score: 25/40
🏆 Rating
International Paper Company presents a robust dividend history with sector relevance. However, elevated payout ratios and negative cash flow yield introduce caution. It's advisable for potential investors to factor in market volatility and divergences in financial metrics while making investment decisions.
Smart Data Insight
Master the Perfect Entry & Exit for this Stock
Don't leave your profits to chance. Historically, this stock follows specific seasonal patterns that institutional traders use to maximize returns.
- ✅ Identify the "Golden Buying Window"
- ✅ Avoid high-risk correction cycles
- ✅ Backtested data from the last 20+ years