October 08, 2025 a 04:45 pm
IPG: Fibunacci Analysis - The Interpublic Group of Companies, Inc.
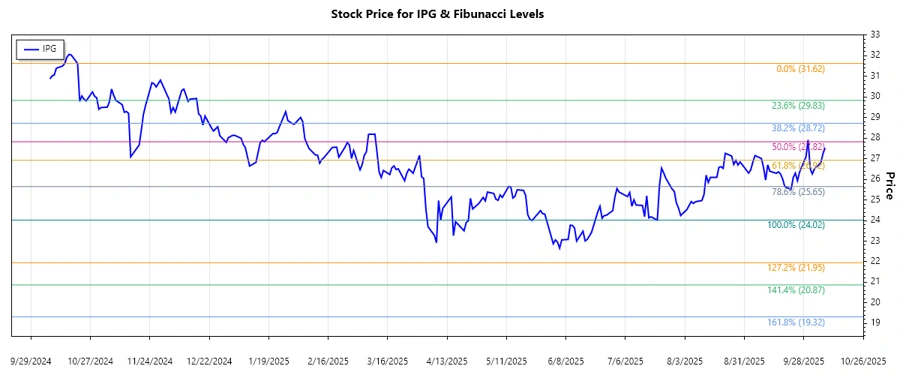
The Interpublic Group of Companies, Inc. (IPG) has experienced a distinct downward trend in its stock price over the past months. From a high of $31.62 in October 2024, the stock has trended downward to a recent low of $24.02 in July 2025. The company's focus on global advertising and marketing services might be facing challenges, reflecting in its decreasing stock value. This market environment suggests careful observation for potential reversal signs or further declines.
Fibunacci Analysis
| Start Date | End Date | High (Price/Date) | Low (Price/Date) |
|---|---|---|---|
| 2024-10-08 | 2025-07-21 | $31.62 / 2024-10-21 | $24.02 / 2025-07-21 |
Fibonacci Retracement Levels
| Level | Price |
|---|---|
| 0.236 | $25.99 |
| 0.382 | $27.05 |
| 0.5 | $27.82 |
| 0.618 | $28.60 |
| 0.786 | $29.57 |
The current stock price is $27.525, which places it in the 0.382 to 0.5 retracement zone, indicating moderate resistance. Should the price hold above this zone, it may signal consolidation before any potential recovery or further decline depending on market conditions.
This level may act as a crucial resistance point, and breaking above might suggest an upward trend or, alternatively, failure to rise above could solidify further declines.
Conclusion
The IPG stock shows a pronounced downward trend, primarily challenged by industry dynamics and market volatility. The current retracement levels are vital for determining short-term resistance and support points that could influence potential investment decisions. While consolidation in the short term might offer stability, lacklustre growth prospects could reflect further depreciation risks. Long-term recovery would depend on market and internal business initiatives to overcome existing challenges. Investors should remain cautious and consider broader market conditions and company-specific developments in their analysis to evaluate potential opportunities or risks.
Smart Data Insight
Master the Perfect Entry & Exit for this Stock
Don't leave your profits to chance. Historically, this stock follows specific seasonal patterns that institutional traders use to maximize returns.
- ✅ Identify the "Golden Buying Window"
- ✅ Avoid high-risk correction cycles
- ✅ Backtested data from the last 20+ years