November 16, 2025 a 07:31 am

IPG: Dividend Analysis - The Interpublic Group of Companies, Inc.
The Interpublic Group of Companies, Inc. stands out with a robust dividend yield of 5.02%, paired with a consistent 31-year dividend payment history. However, the elevated EPS payout ratio of 110.22% and moderate growth rate demand careful scrutiny for sustaining strong investor confidence.
📊 Overview
The overview of dividend metrics provides key insights into the company's dividend-paying capabilities and reliability, which are vital for income-focused investors.
| Detail | Value |
|---|---|
| Sector | Advertising & Marketing |
| Dividend yield | 5.02% |
| Current dividend per share | 1.32 USD |
| Dividend history | 31 years |
| Last cut or suspension | None |
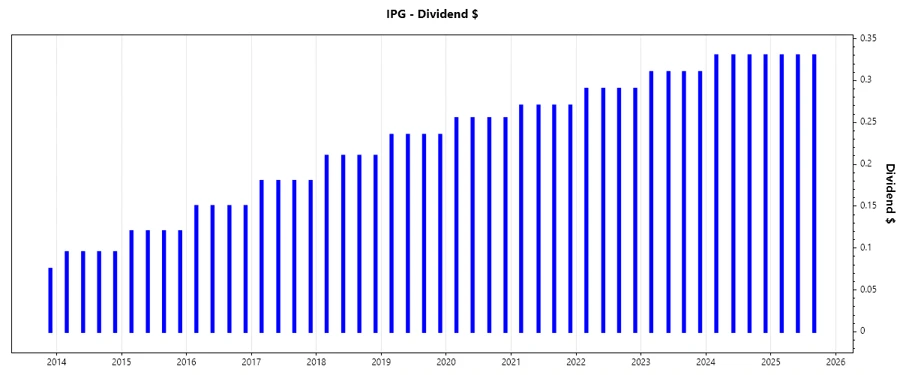
🗣️ Dividend History
Analyzing dividend history reveals the firm's track record in sustaining and growing shareholder returns. This is crucial for assessing future payout predictability.
| Year | Dividend per Share (USD) |
|---|---|
| 2025 | 0.99 |
| 2024 | 1.32 |
| 2023 | 1.24 |
| 2022 | 1.16 |
| 2021 | 1.08 |
📈 Dividend Growth
Dividend growth evaluates the company's ability to increase its payouts over time, which is an indicator of its financial health and operational success.
| Time | Growth |
|---|---|
| 3 years | 6.92% |
| 5 years | 7.03% |
The average dividend growth is 7.03% over 5 years. This shows moderate but steady dividend growth.
📉 Payout Ratio
The payout ratio illustrates how much of the company's earnings and cash flow are returned to shareholders via dividends, critical for appraising dividend sustainability.
| Key figure | Ratio |
|---|---|
| EPS-based | 110.22% |
| Free cash flow-based | 57.26% |
With an EPS payout ratio of 110.22%, the dividend is unsustainably high unless earnings grow significantly, while the FCF ratio of 57.26% indicates a more manageable payout relative to cash generation.
✅ Cashflow & Capital Efficiency
Assessing cash flow and capital efficiency metrics offers insights into a firm's operational dynamics and its ability to maintain dividends through various economic cycles.
| Metric | 2024 | 2023 | 2022 |
|---|---|---|---|
| Free Cash Flow Yield | 8.69% | 2.99% | 3.30% |
| Earnings Yield | 6.56% | 8.76% | 7.19% |
| CAPEX to Operating Cash Flow | 13.44% | 32.32% | 29.25% |
| Stock-based Compensation to Revenue | 0.61% | 0.43% | 0.46% |
| Free Cash Flow / Operating Cash Flow Ratio | 86.56% | 67.68% | 70.75% |
The stability in free cash flow and efficient capital allocation underscores effective operational management, supporting satisfactory due diligence for dividend coverage.
🗣️ Balance Sheet & Leverage Analysis
Balance sheet and leverage analysis provide insights into the company's financial structure, debt management, and overall financial health.
| Metric | 2024 | 2023 | 2022 |
|---|---|---|---|
| Debt-to-Equity | 1.12 | 1.18 | 1.24 |
| Debt-to-Assets | 23.22% | 24.24% | 24.05% |
| Debt-to-Capital | 52.84% | 54.23% | 55.40% |
| Net Debt to EBITDA | 1.34 | 1.20 | 1.16 |
| Current Ratio | 1.09 | 1.06 | 1.03 |
| Quick Ratio | 1.09 | 1.06 | 1.03 |
| Financial Leverage | 4.83 | 4.89 | 5.17 |
The increasing debt ratios suggest potential financial risk, while maintaining a sound liquidity profile moderately alleviates balance sheet concerns.
📊 Fundamental Strength & Profitability
Delving into fundamental strength and profitability measures the company's effectiveness in utilizing its resources for growth and sustaining dividends.
| Metric | 2024 | 2023 | 2022 |
|---|---|---|---|
| Return on Equity | 18.16% | 27.86% | 25.71% |
| Return on Assets | 3.76% | 5.70% | 4.98% |
| Net Margin | 6.45% | 10.09% | 8.58% |
| EBIT Margin | 11.96% | 15.00% | 13.15% |
| EBITDA Margin | 14.38% | 17.43% | 15.66% |
| Gross Margin | 17.02% | 16.66% | 16.88% |
| Research & Development to Revenue | 0% | 0% | 0% |
The strong returns indicate the firm's profitability, though the absence of R&D expenditure might affect future innovation and competitive edge.
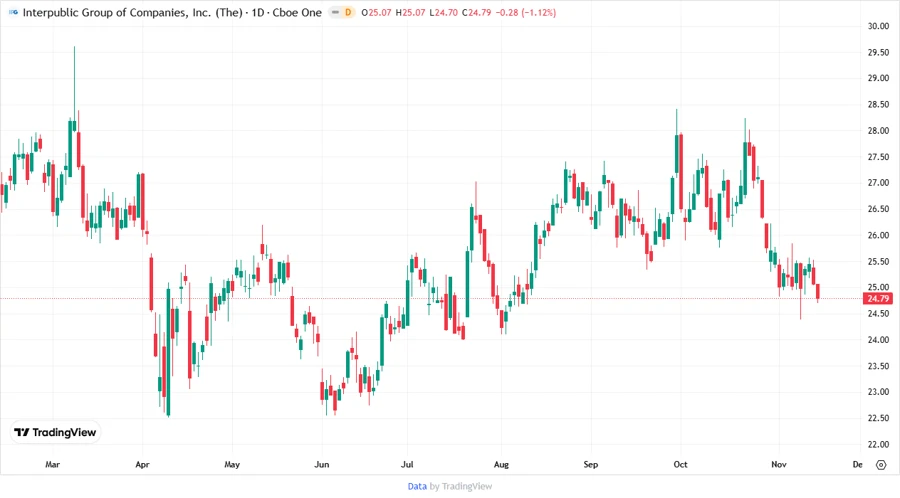
Price Development
Dividend Scoring System
| Criteria | Description | Score |
|---|---|---|
| Dividend yield | 5.02% provides attractive income | |
| Dividend Stability | 31 years of continuous dividends | |
| Dividend growth | Modest growth over 5 years | |
| Payout ratio | EPS payout is over 100% | |
| Financial stability | Sound but highly leveraged | |
| Dividend continuity | No past cuts, solid history | |
| Cashflow Coverage | Free cash flow covers dividends | |
| Balance Sheet Quality | Leveraged with moderate liquidity |
Total Score: 35/40
Rating
The Interpublic Group of Companies, Inc. demonstrates strong dividend reliability with a historically high yield and notable stability. However, high payout ratios and leverage present risks. Recommended for experienced investors seeking income with an appetite for underlying volatility.
Smart Data Insight
Master the Perfect Entry & Exit for this Stock
Don't leave your profits to chance. Historically, this stock follows specific seasonal patterns that institutional traders use to maximize returns.
- ✅ Identify the "Golden Buying Window"
- ✅ Avoid high-risk correction cycles
- ✅ Backtested data from the last 20+ years