February 17, 2026 a 09:03 am

INVH: Trend and Support & Resistance Analysis - Invitation Homes Inc.
Invitation Homes Inc. demonstrates a fluctuating trend pattern over recent months. The company, which primarily leases single-family homes, offers potential for growth in housing demand. However, the stock has exhibited volatility, reflecting broader market conditions. Analyzing the recent price history helps investors identify critical support and resistance levels that may influence future price movements. Market participants should consider external economic factors that might affect stock performance.
Trend Analysis
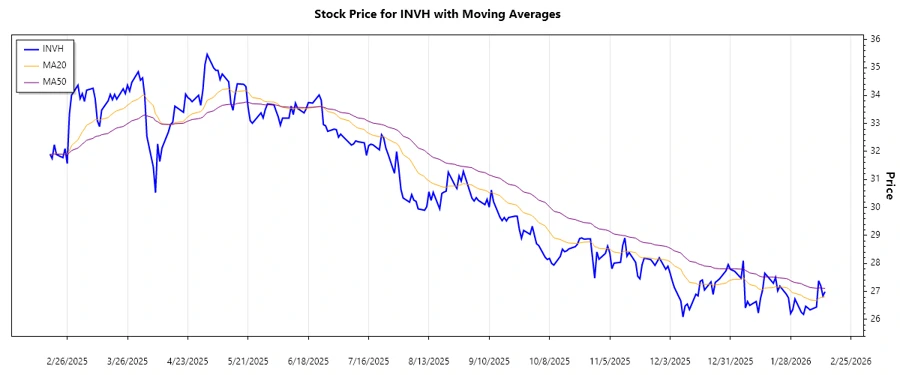
The historical price data for Invitation Homes Inc. over recent months reveals shifts between upward, downward, and sideways movements. By calculating the EMA20 and EMA50 from the closing prices, we observe:
| Date | Closing Price | Trend |
|---|---|---|
| 2026-02-13 | $26.99 | ▼ Abwärtstrend |
| 2026-02-12 | $26.84 | ▼ Abwärtstrend |
| 2026-02-11 | $27.20 | ▲ Aufwärtstrend |
| 2026-02-10 | $27.38 | ▲ Aufwärtstrend |
| 2026-02-09 | $26.44 | ▼ Abwärtstrend |
| 2026-02-06 | $26.34 | ▼ Abwärtstrend |
| 2026-02-05 | $26.41 | ⚖️ Seitwärtstrend |
The EMA20 and EMA50 computations reveal a mixed trend where EMA20 hovers around the EMA50, indicating brief trends both upwards and downwards. This suggests a cautious approach to trading based on these averages.
Support and Resistance
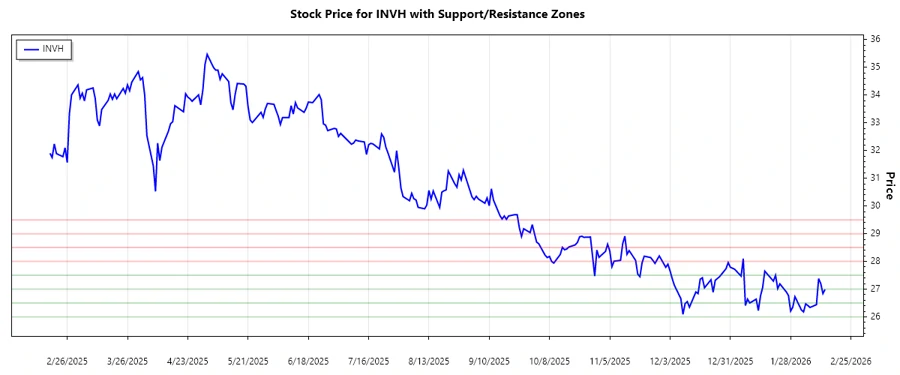
An analysis of the current price data identifies potential support and resistance zones:
| Zone Type | Range |
|---|---|
| Support Zone 1 | ↓ $26.00 - $26.50 |
| Support Zone 2 | ↓ $27.00 - $27.50 |
| Resistance Zone 1 | ↑ $28.00 - $28.50 |
| Resistance Zone 2 | ↑ $29.00 - $29.50 |
Currently, the price is approaching the lower support zone of $26.00 - $26.50, suggesting a potential rebound if demand increases at these levels.
Technically, these zones indicate areas where market participants have historically shown interest, affecting potential future price directions.
Conclusion
The recent technical analysis of Invitation Homes Inc. reveals both opportunities and risks. The stock is at a juncture, with support zones potentially providing a floor for prices, offering trading opportunities for the risk-tolerant. Resistance zones act as ceilings, reflecting areas of selling pressure. Investors should weigh these zones relative to their risk appetite against broader market conditions. Overall, the stock's movements underline the influence of economic factors on the real estate sector and demand for single-family home leasing. As always, maintaining an informed perspective with market developments is crucial for aligning investment strategies.