January 10, 2026 a 01:15 pm
INVH: Trend and Support & Resistance Analysis - Invitation Homes Inc.
Invitation Homes Inc. engages in a rapidly growing real estate market, focusing on leasing single-family homes in the United States. The stock has demonstrated volatility over the past few months, with significant movements leading to a dynamic trading range. Understanding the technical trends and support/resistance levels could provide valuable insights into potential future price movements.
Trend Analysis
| Date | Closing Price | Trend |
|---|---|---|
| 2026-01-09 | $26.50 | ▼ Downtrend |
| 2026-01-08 | $26.64 | ▼ Downtrend |
| 2026-01-07 | $26.41 | ▼ Downtrend |
| 2026-01-06 | $28.10 | ▲ Upward Trend |
| 2026-01-05 | $27.47 | ▲ Upward Trend |
| 2026-01-02 | $27.72 | ▲ Upward Trend |
| 2025-12-31 | $27.79 | ▲ Upward Trend |
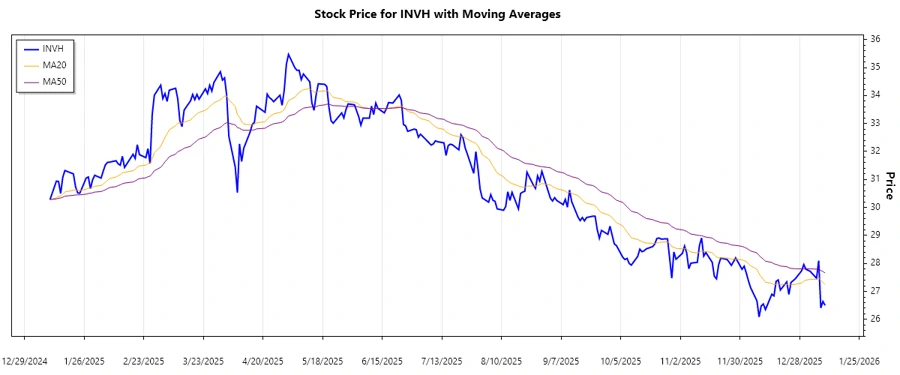
Based on the EMA calculations, recent trends show a shift to a downward movement as EMA20 is less than EMA50. Implement additional risk management strategies at this time.
Support and Resistance
| Zone Type | From | To |
|---|---|---|
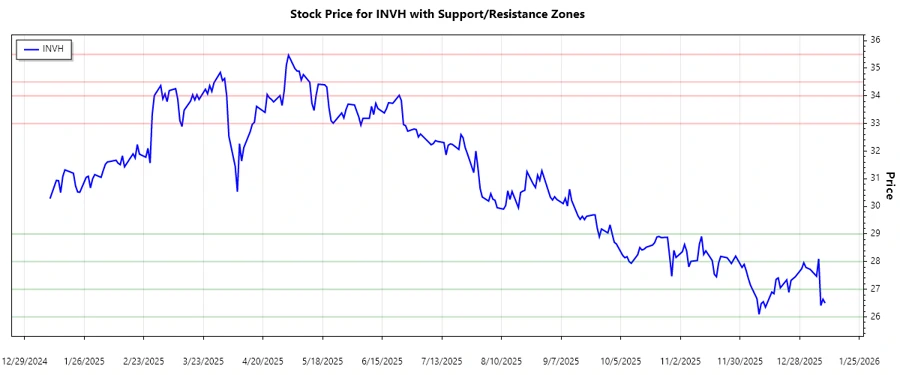
| Support Zone | $26 | $27 |
| Support Zone | $28 | $29 |
| Resistance Zone | $33 | $34 |
| Resistance Zone | $34.5 | $35.5 |
The current price is within the support zone of $26-$27, indicating potential buying opportunities for investors provided other market conditions align.
Conclusion
INVH shows a potential downtrend continuation unless it breaks past identified resistance zones. Given its current position within a support zone, there's an opportunity for price reversal, but caution is advised. Investors should closely monitor additional indicators and market news to navigate potential risks and capitalize on possible market movements. Analyst insights suggest balancing this outlook with fundamental analysis for a comprehensive investment strategy.