May 10, 2026 a 07:31 am
![[Company Image]](./n//INVHdpdp-Dividend-Analysis-minmin-Invitation-Homes-Inc-at-date-2026-05-10/images/image1.webp)
INVH: Dividend Analysis - Invitation Homes Inc.
Invitation Homes Inc. presents an intriguing dividend profile featuring a solid yield and consistent dividend payout history, making it an appealing choice for income-focused investors. However, its high EPS payout ratio suggests possible sustainability concerns if earnings growth does not improve. Cautious monitoring of its financial health and payout ratios is necessary to ensure long-term investment viability.
📊 Overview
The following table provides a snapshot of the key dividend metrics for Invitation Homes Inc., offering insight into its sectoral context and dividend policy stability.
| Metric | Value |
|---|---|
| Sector | Real Estate |
| Dividend Yield | 4.75 % |
| Current Dividend per Share | 1.16 USD |
| Dividend History | 10 years |
| Last Cut or Suspension | None |
🔍 Dividend History
Invitation Homes Inc. has maintained a stable dividend payout over the past decade, highlighting its commitment to returning value to shareholders. This historical consistency is vital for investors relying on dividend income.
| Year | Dividend per Share (USD) |
|---|---|
| 2026 | 0.30 |
| 2025 | 1.17 |
| 2024 | 1.13 |
| 2023 | 1.32 |
| 2022 | 0.88 |
📈 Dividend Growth
Dividend growth is an important indicator of a company's financial health and potential for future payout increases. Analyzing the growth over different time frames helps investors gauge the sustainability and progression of dividend payments.
| Time | Growth |
|---|---|
| 3 years | 9.96 % |
| 5 years | 14.29 % |
The average dividend growth is 14.29 % over 5 years. This shows moderate but steady dividend growth, providing confidence in the company's commitment to increasing shareholder returns.
✅ Payout Ratio
Payout ratios are critical for understanding the proportion of earnings and cash flow devoted to dividend payments, influencing the sustainability of these payouts.
| Key Figure | Ratio |
|---|---|
| EPS-based | 120.95 % |
| Free Cash Flow-based | 60.93 % |
The 120.95 % EPS-based payout ratio exceeds 100%, suggesting potential sustainability issues. However, the 60.93 % FCF-based ratio indicates a moderate level of comfort, hinting at better cash flow management.
⚠️ Cashflow & Capital Efficiency
Understanding cash flow metrics is imperative for assessing the company's ability to cover dividends from operational earnings and capital investments. Analyzing these figures helps evaluate the financial robustness of the business model.
| Metric | 2025 | 2024 | 2023 |
|---|---|---|---|
| Free Cash Flow Yield | 5.66 % | 4.40 % | 4.24 % |
| Earnings Yield | 3.45 % | 2.32 % | 2.49 % |
| CAPEX to Operating Cash Flow | 20.12 % | 20.28 % | 19.97 % |
| Stock-based Compensation to Revenue | 1.02 % | 1.06 % | 1.21 % |
| Free Cash Flow / Operating Cash Flow Ratio | 79.88 % | 79.72 % | 80.03 % |
These metrics signify solid capital efficiency, with reasonable CAPEX and healthy free cash flow ratios, which underpin dividend coverage.
📉 Balance Sheet & Leverage Analysis
A company's balance sheet strength and leverage ratios are crucial in measuring financial risk and liquidity, which can significantly impact dividend security.
| Metric | 2025 | 2024 | 2023 |
|---|---|---|---|
| Debt-to-Equity | 0.88 | 0.84 | 0.84 |
| Debt-to-Assets | 0.45 | 0.44 | 0.44 |
| Debt-to-Capital | 0.47 | 0.46 | 0.46 |
| Net Debt to EBITDA | 5.60 | 5.23 | 5.13 |
| Current Ratio | 1.52 | 0.82 | 5.71 |
| Quick Ratio | 1.52 | 0.82 | 5.71 |
| Financial Leverage | 1.96 | 1.92 | 1.89 |
The financial leverage and debt metrics indicate moderate leverage, suggesting manageable financial risk, although ongoing monitoring is necessary.
🏅 Fundamental Strength & Profitability
Fundamental strength is evaluated by profitability ratios, which show the company's ability to generate earnings relative to its costs and assets, thereby affecting dividend potential.
| Metric | 2025 | 2024 | 2023 |
|---|---|---|---|
| Return on Equity | 6.17 % | 4.65 % | 5.11 % |
| Return on Assets | 3.15 % | 2.43 % | 2.70 % |
| Net Profit Margin | 21.54 % | 17.33 % | 21.36 % |
| EBIT Margin | 26.56 % | 31.37 % | 35.13 % |
| EBITDA Margin | 53.93 % | 58.64 % | 62.85 % |
| Gross Margin | 3.69 % | 59.04 % | 59.87 % |
| Research & Development to Revenue | 0 % | 0 % | 0 % |
The company demonstrates moderate efficiency in converting revenue into profit, supported by solid margins indicating profitability strength with room for improvement.
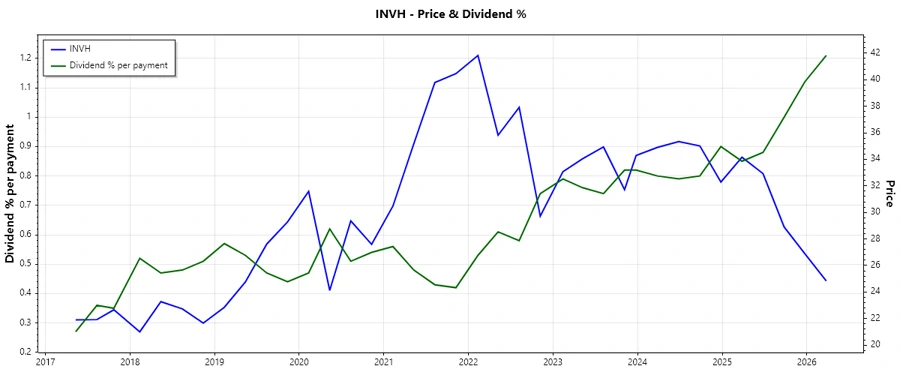
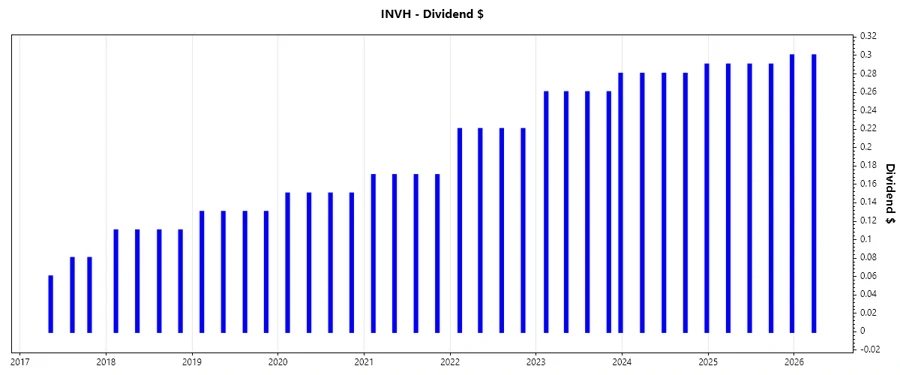
💹 Price Development
🎯 Dividend Scoring System
| Criterion | Score | Score Bar |
|---|---|---|
| Dividend Yield | 4 | |
| Dividend Stability | 4 | |
| Dividend Growth | 3 | |
| Payout Ratio | 2 | |
| Financial Stability | 3 | |
| Dividend Continuity | 5 | |
| Cashflow Coverage | 3 | |
| Balance Sheet Quality | 3 |
Overall Score: 27 out of 40
🔍 Rating
Invitation Homes Inc. offers an attractive dividend yield, supported by a consistent payout history and moderate financial stability. However, its high EPS payout ratio signals potential caution. Investors drawn to its robust dividend yield and sustainable cashflow management should remain vigilant regarding income sustainability. Suitable for income-seeking investors but warrants monitoring of underlying financial health.
Smart Data Insight
Master the Perfect Entry & Exit for this Stock
Don't leave your profits to chance. Historically, this stock follows specific seasonal patterns that institutional traders use to maximize returns.
- ✅ Identify the "Golden Buying Window"
- ✅ Avoid high-risk correction cycles
- ✅ Backtested data from the last 20+ years