January 26, 2026 a 07:46 am

INVH: Dividend Analysis - Invitation Homes Inc.
Invitation Homes Inc. offers a significant and stable dividend yield with a moderate growth trajectory. The company's payout ratios and financial metrics reflect its capacity to maintain dividends. However, attention should be given to recent changes in its dividend policy and market conditions that could impact future distributions.
📊 Overview
Invitation Homes Inc., operating in the real estate sector, presents a robust dividend proposition. This is characterized by a comparatively high yield, steady historical payouts, and sustainable growth metrics.
| Metric | Value |
|---|---|
| Sector | Real Estate |
| Dividend yield | 4.35% |
| Current dividend per share | 1.1252 USD |
| Dividend history | 9 years |
| Last cut or suspension | 2024 |
🗣️ Dividend History
The dividend history of Invitation Homes Inc. reflects its commitment to shareholder returns. The company's ability to sustain and gradually increase dividends over the past 9 years demonstrates its financial health and management's focus on long-term stability.
| Year | Dividend per Share (USD) |
|---|---|
| 2025 | 1.17 |
| 2024 | 1.13 |
| 2023 | 1.32 |
| 2022 | 0.88 |
| 2021 | 0.68 |
📈 Dividend Growth
Dividend growth is a critical indicator of a company's profitability and its ability to enhance shareholder value. Invitation Homes Inc. has experienced notable dividend growth, which underscores the trustworthiness of its long-term dividend policy.
| Time | Growth |
|---|---|
| 3 years | 9.96% |
| 5 years | 14.29% |
The average dividend growth is 14.29% over 5 years. This shows moderate but steady dividend growth.
📉 Payout Ratio
A healthy payout ratio is crucial for sustaining future dividend payments. Invitation Homes Inc.'s payout ratios reveal insights into its earnings distribution efficiency and policy sustainability.
| Key figure | Ratio |
|---|---|
| EPS-based | 117.62% |
| Free cash flow-based | 59.53% |
The EPS-based payout ratio of 117.62% indicates that the company is paying out more in dividends than it earns in EPS, potentially unsustainable in the long term. However, the FCF-based ratio of 59.53% is more balanced, suggesting better management of cash flows.
✅ Cashflow & Capital Efficiency
Analyzing cash flow and capital efficiency allows investors to understand how effectively Invitation Homes Inc. generates and uses cash, and the quality of its capital investments.
| Year | 2024 | 2023 | 2022 |
|---|---|---|---|
| Free Cash Flow Yield | 4.40% | 4.24% | 4.51% |
| Earnings Yield | 2.32% | 2.49% | 2.12% |
| CAPEX to Operating Cash Flow | 20.28% | 19.97% | 20.33% |
| Stock-based Compensation to Revenue | 1.07% | 1.21% | 1.29% |
The consistently positive free cash flow yield supports the company's ability to sustain dividends. However, the relatively high CAPEX to operating cash flow ratio needs to be watched as it reflects the proportion of cash used for capital investments.
⚠️ Balance Sheet & Leverage Analysis
This section highlights the financial leverage and balance sheet health of Invitation Homes Inc., key factors in assessing its risk profile and credit health.
| Year | 2024 | 2023 | 2022 |
|---|---|---|---|
| Debt-to-Equity | 0.84 | 0.84 | 0.75 |
| Net Debt to EBITDA | 4.79 | 5.13 | 5.66 |
| Current Ratio | 1.51 | 5.71 | 3.41 |
| Quick Ratio | 0.82 | 5.71 | 3.41 |
The stable debt-to-equity ratio and improved current ratio reflect a strengthening financial position while a high net debt to EBITDA ratio suggests potential leverage risk.
📈 Fundamental Strength & Profitability
These metrics highlight financial performance and operational efficiency, essential for a comprehensive assessment of Invitation Homes Inc.'s profitability.
| Year | 2024 | 2023 | 2022 |
|---|---|---|---|
| Return on Equity | 4.65% | 5.11% | 3.72% |
| Return on Assets | 2.43% | 2.70% | 2.07% |
| Net Margin | 17.33% | 21.36% | 17.13% |
| Gross Margin | 59.04% | 59.87% | 60.94% |
Steady profitability margins and positive returns highlight the company's effective asset utilization and operational efficiency, although room for improving return metrics remains.
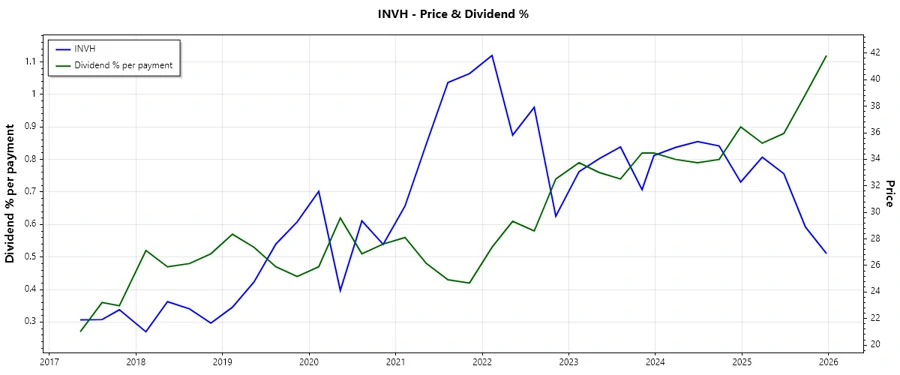
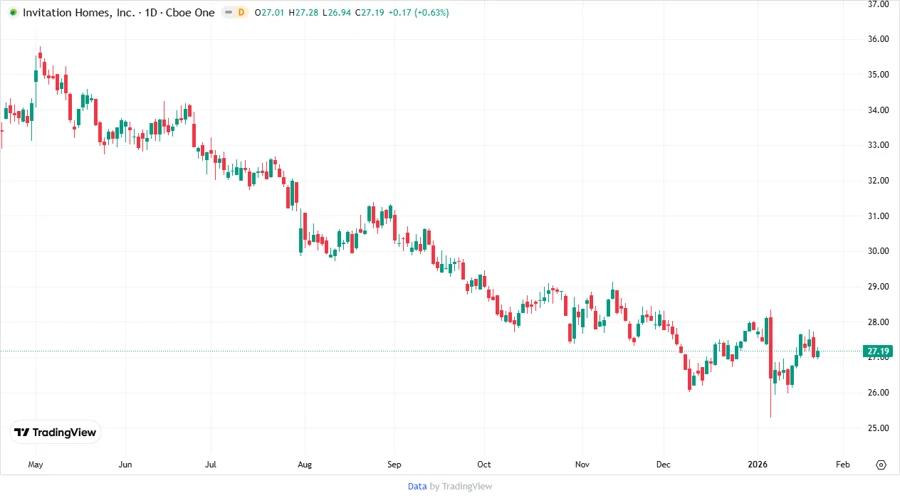
Price Development
✅ Dividend Scoring System
Invitation Homes Inc.'s dividend evaluation system encompasses various aspects of its financial health relating to dividends.
| Category | Description | Score |
|---|---|---|
| Dividend yield | Evaluates the attractiveness of the dividend | |
| Dividend Stability | The consistency of dividend payments over time | |
| Dividend growth | Increase in dividends over a specific period | |
| Payout ratio | Portion of earnings paid out as dividends | |
| Financial stability | Overall financial health of the company | |
| Dividend continuity | Track record of continuing dividends | |
| Cashflow Coverage | Ability to cover dividends from cash flows | |
| Balance Sheet Quality | Strength and resilience of the balance sheet |
Total Score: 45/60
🗣️ Rating
Based on the analysis, Invitation Homes Inc. shows a robust dividend profile with an excellent yield, decent stability, and a modest growth trend. However, there are points of consideration regarding its payout ratio and leverage. The company's fundamentals offer a solid investment appeal for dividend-focused investors, while any investment should be hedged against the cyclical nature of the real estate market.