December 23, 2025 a 07:31 am
INVH: Dividend Analysis - Invitation Homes Inc.
Invitation Homes Inc. offers a reliable dividend yield, showcasing steady growth in its shareholder returns over the years. Despite a relatively high payout ratio based on EPS, its solid free cash flow coverage indicates potential sustainability. Investors will find interest in its moderate, yet consistent, dividend growth and robust sector positioning.
📊 Overview
Invitation Homes Inc. operates primarily within the real estate sector. With a current dividend yield of 4.30%, the company offers an attractive income opportunity. Shareholders have benefited from a consistent dividend history spanning 9 years, although there was a recent cut or suspension in 2024, which should be monitored.
| Parameter | Details |
|---|---|
| Sector | Real Estate |
| Dividend Yield | 4.30% |
| Current Dividend Per Share | $1.13 |
| Dividend History | 9 years |
| Last Cut or Suspension | 2024 |
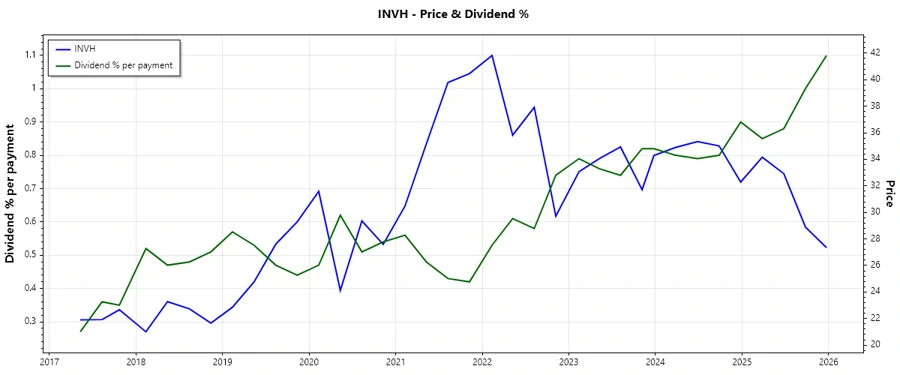
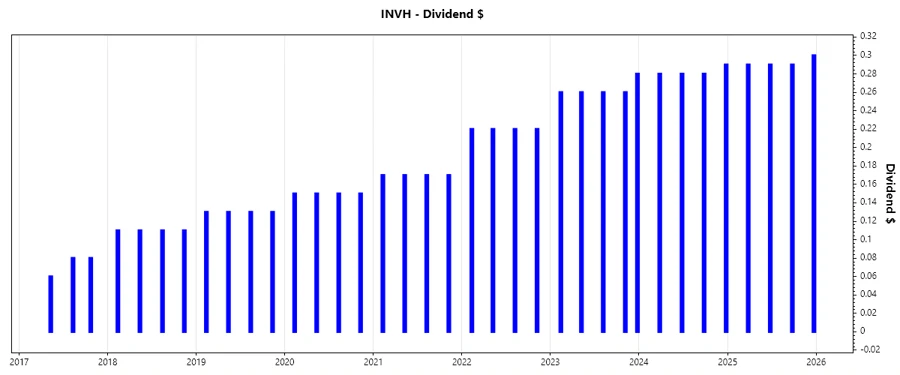
📈 Dividend History
The company's dividend payments reflect its commitment to providing consistent returns, which is a key factor for income-focused investors. Stability in dividends can instill investor confidence and drive long-term value.
| Year | Dividend Per Share (USD) |
|---|---|
| 2025 | 1.17 |
| 2024 | 1.13 |
| 2023 | 1.32 |
| 2022 | 0.88 |
| 2021 | 0.68 |
✅ Dividend Growth
Examining dividend growth provides insights into the company's ability to enhance shareholder returns over time, reflecting business health and financial discipline. Invitation Homes shows a steady growth trajectory which supports its long-term viability.
| Time | Growth (%) |
|---|---|
| 3 years | 18.45% |
| 5 years | 16.79% |
The average dividend growth is 16.79% over 5 years. This shows moderate but steady dividend growth.
⚠️ Payout Ratio
The payout ratio is crucial in assessing whether a company can maintain its dividend levels. An EPS-based payout of 117.62% suggests a potential risk as the company is paying more than its earnings. However, a FCF-based payout of 59.53% indicates that dividends are adequately covered by cash flows.
| Key Figure | Ratio |
|---|---|
| EPS-based | 117.62% |
| Free Cash Flow-based | 59.53% |
While the EPS-based payout ratio is worrying, the free cash flow-based payout provides reassurance about the dividend's sustainability.
💰 Cashflow & Capital Efficiency
Evaluating cash flow and capital efficiency reveals the company's operational robustness and ability to reinvest. A positive free cash flow yield and strong FCF/OCF ratio highlight operational efficiency, crucial for maintaining and potentially growing dividends.
| Year | 2024 | 2023 | 2022 |
|---|---|---|---|
| Free Cash Flow Yield | 4.40% | 4.24% | 4.51% |
| Earnings Yield | 2.32% | 2.49% | 2.12% |
| CAPEX to Operating Cash Flow | 20.28% | 19.97% | 20.33% |
| Stock-based Compensation to Revenue | 1.07% | 1.21% | 1.29% |
| Free Cash Flow / Operating Cash Flow Ratio | 79.72% | 80.03% | 79.67% |
The stability of free cash flow yield and efficiency ratios assure investors of the company's capacity to sustain dividends and invest in growth.
🗣️ Balance Sheet & Leverage Analysis
A strong balance sheet and manageable leverage are vital for financial stability, influencing dividend safety. A balanced debt-to-equity and reasonable net debt to EBITDA ratio suggest prudent financial management.
| Year | 2024 | 2023 | 2022 |
|---|---|---|---|
| Debt-to-Equity | 0.84 | 0.84 | 0.75 |
| Debt-to-Assets | 0.44 | 0.44 | 0.42 |
| Debt-to-Capital | 0.46 | 0.46 | 0.43 |
| Net Debt to EBITDA | 5.23 | 5.13 | 5.66 |
| Current Ratio | 0.82 | 5.71 | 3.41 |
| Quick Ratio | 0.82 | 5.71 | 3.41 |
| Financial Leverage | 1.92 | 1.89 | 1.80 |
The consistency across leverage ratios and current assets suggests a solid ability to meet financial obligations, supporting dividend reliability amidst market volatility.
📉 Fundamental Strength & Profitability
Profitability ratios indicate the company’s efficiency compared to peers. While profit margins remain robust, the key profitability metrics underscore long-term viability and ability to provide consistent returns to shareholders.
| Year | 2024 | 2023 | 2022 |
|---|---|---|---|
| Return on Equity | 4.65% | 5.11% | 3.72% |
| Return on Assets | 2.43% | 2.70% | 2.07% |
| Return on Invested Capital | 4.02% | 3.56% | 3.43% |
| Net Profit Margin | 17.33% | 21.36% | 17.13% |
| EBIT Margin | 31.37% | 35.13% | 30.78% |
| EBITDA Margin | 58.64% | 62.85% | 59.29% |
| Gross Margin | 59.04% | 59.87% | 60.94% |
| R&D to Revenue | 0% | 0% | 0% |
Despite some fluctuations, Invitation Homes maintains competitive profitability metrics, which bodes well for sustaining dividends.
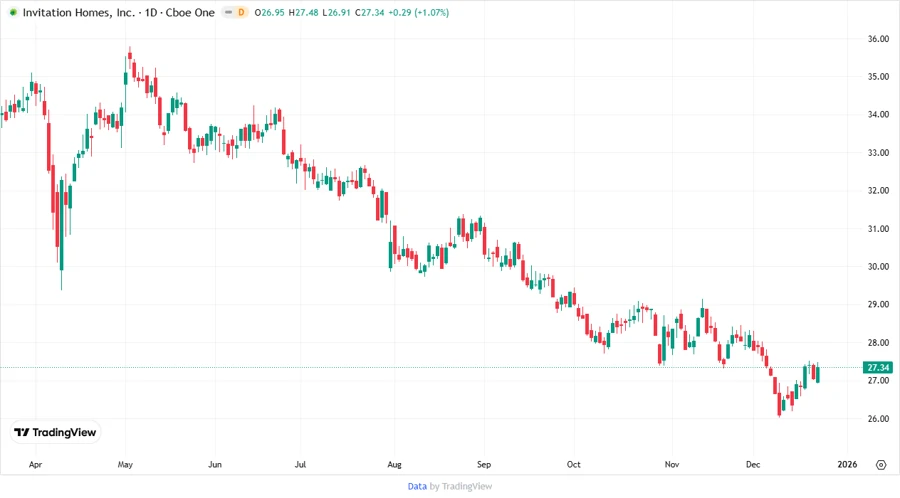
📈 Price Development
🎯 Dividend Scoring System
| Category | Score (1-5) | Score Bar |
|---|---|---|
| Dividend yield | 4 | |
| Dividend Stability | 3 | |
| Dividend growth | 4 | |
| Payout ratio | 2 | |
| Financial stability | 3 | |
| Dividend continuity | 3 | |
| Cashflow Coverage | 4 | |
| Balance Sheet Quality | 3 |
Overall Score: 26/40
💡 Rating
The assessment for Invitation Homes Inc. highlights a fairly strong dividend profile with notable potential for reliable income generation. While the current payout ratios suggest caution, sound cash flow management and reasonable capital efficiency support the dividend's sustainability. Investors may find this company suitable for income-focused portfolios, balanced with growth expectations.