November 03, 2025 a 07:31 am


INVH: Dividend Analysis - Invitation Homes Inc.
Invitation Homes Inc. currently offers a substantial dividend yield with a historically consistent payment trend. While it navigates moderate earning pressures, its dividend growth rate offers investors a compelling glimpse into future potential income. Recent dividend stabilizations suggest strategic alignment towards fostering shareholder value amidst market fluctuations.
Overview 📊
Invitation Homes Inc. (INVH), operating within the Real Estate Sector, presents its shareholders with a dividend yield of 4.01%. The most recent current dividend per share stands at 1.13 USD, emphasizing a commitment to sustained shareholder returns over a remarkable span of 9 years. Importantly, there have been no recent cuts or suspensions, thereby projecting confidence in dividend reliability.
| Factor | Details |
|---|---|
| Sector | Real Estate |
| Dividend Yield | 4.01% |
| Current Dividend Per Share | 1.13 USD |
| Dividend History | 9 years |
| Last Cut or Suspension | None |
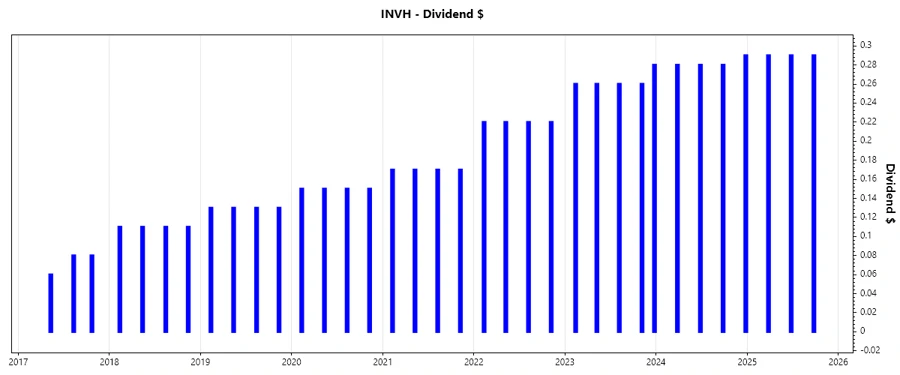
Dividend History 🗣️
A review of the dividend history reveals a medley of strategic increases punctuated with cautious market adaptations. Such historical data, especially during economic ebbs, proves invaluable in forecasting a company's prioritization of shareholder returns.
| Year | Dividend Per Share (USD) |
|---|---|
| 2025 | 0.87 |
| 2024 | 1.13 |
| 2023 | 1.32 |
| 2022 | 0.88 |
| 2021 | 0.68 |
Dividend Growth 📈
Assessing dividend growth offers insight into future income potential. Over the past 3 years, the dividends have grown by an average of 18.45%, while a 5-year perspective reveals a stable increase of 16.79%, reflecting a steady upward trajectory.
| Time | Growth |
|---|---|
| 3 years | 18.45% |
| 5 years | 16.79% |
The average dividend growth is 16.79% over 5 years. This shows moderate but steady dividend growth.
Payout Ratio ⚠️
Payout ratios offer a window into the sustainability of dividend payments. An EPS-based payout ratio of 117.62% signals payouts surpass earnings, while an FCF-based ratio of 59.53% implies significant coverage from cash flows.
| Key Figure | Ratio |
|---|---|
| EPS-based | 117.62% |
| Free cash flow-based | 59.53% |
Although the EPS-based payout ratio is notably high, indicating potential profit insufficiency, the FCF-based ratio provides comfort in the company's ability to cover dividends through its cash flow operations.
Cashflow & Capital Efficiency 💵
Efficient cashflow management and capital allocation underline a firm's profitability and operational excellence.
| Year | 2024 | 2023 | 2022 |
|---|---|---|---|
| Free Cash Flow Yield | 0.044 | 0.042 | 0.045 |
| Earnings Yield | 0.023 | 0.025 | 0.021 |
| CAPEX to Operating Cash Flow | 0.203 | 0.200 | 0.203 |
| Stock-based Compensation to Revenue | 0.011 | 0.012 | 0.013 |
| Free Cash Flow / Operating Cash Flow Ratio | 0.797 | 0.800 | 0.797 |
The company's ability to consistently generate free cash flow relative to its operating cash indicates financial robustness necessary to meet dividend obligations and invest in long-term growth.
Balance Sheet & Leverage Analysis 📚
The strength of a company's balance sheet and leverage ratios are pivotal in analyzing financial health, liquid capital, and debt strategy.
| Year | 2024 | 2023 | 2022 |
|---|---|---|---|
| Debt-to-Equity | 0.841 | 0.841 | 0.755 |
| Debt-to-Assets | 0.439 | 0.445 | 0.419 |
| Debt-to-Capital | 0.457 | 0.457 | 0.430 |
| Net Debt to EBITDA | 5.227 | 5.132 | 5.657 |
| Current Ratio | 0.825 | 5.705 | 3.415 |
| Quick Ratio | 0.825 | 5.705 | 3.415 |
A stable Debt-to-Capital ratio and adequate interest coverage suggest manageable leverage and a solid liquidity position, enhancing the ability to withstand financial adversities.
Fundamental Strength & Profitability 🔎
Fundamental financial health and profitability margins paint a comprehensive picture of operational efficacy and strategic fiscal planning.
| Year | 2024 | 2023 | 2022 |
|---|---|---|---|
| Return on Equity | 0.046 | 0.051 | 0.037 |
| Return on Assets | 0.024 | 0.027 | 0.021 |
| Margins: Net | 0.173 | 0.214 | 0.171 |
| EBIT | 0.314 | 0.351 | 0.308 |
| EBITDA | 0.586 | 0.629 | 0.593 |
| Gross | 0.590 | 0.599 | 0.609 |
Consistent profitability margins and positive returns on asset and equity underscore operational efficiency and a resilient profit-making capability.
Price Development 🏷️
Dividend Scoring System ✅
| Category | Score (1-5) | Score Bar |
|---|---|---|
| Dividend yield | 4 | |
| Dividend Stability | 5 | |
| Dividend growth | 4 | |
| Payout ratio | 3 | |
| Financial stability | 4 | |
| Dividend continuity | 5 | |
| Cashflow Coverage | 4 | |
| Balance Sheet Quality | 4 |
Total Score: 33/40
Rating 🏅
Invitation Homes Inc. boasts a diverse dividend offering replete with a robust yield, comprehensive growth trajectory, and an embracement of financial prudence. The balance between dividend distribution and financial obligations aligns favorably, reflecting a well-rounded investment worthy of consideration for income-focused portfolios.
Smart Data Insight
Master the Perfect Entry & Exit for this Stock
Don't leave your profits to chance. Historically, this stock follows specific seasonal patterns that institutional traders use to maximize returns.
- ✅ Identify the "Golden Buying Window"
- ✅ Avoid high-risk correction cycles
- ✅ Backtested data from the last 20+ years