October 15, 2025 a 07:46 am

INVH: Dividend Analysis - Invitation Homes Inc.
Invitation Homes Inc. stands as a notable player in the real estate sector, displaying a commendable dividend yield, underscoring its attractiveness for income-seeking investors. Despite a relatively high payout ratio, the company's consistent dividend history and potential for growth remain key attractions. The financial health, marked by moderate leverage and prudent cash flow management, warrants a thoughtful consideration for both long-term growth and income potential.
📊 Overview
| Aspect | Details |
|---|---|
| Sector | Real Estate |
| Dividend Yield | 4.01% |
| Current Dividend Per Share | 1.13 USD |
| Dividend History | 9 years |
| Last Cut or Suspension | None |
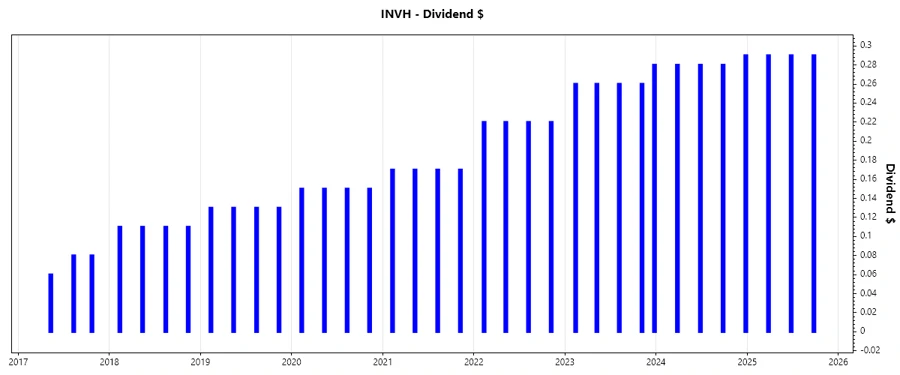
🗣️ Dividend History
The robustness of a company's dividend history provides insights into its reliability and the predictability of income for investors. A stable, unbroken dividend record can enhance investor confidence and attract long-term investment.
| Year | Dividend Per Share (USD) |
|---|---|
| 2025 | 0.87 |
| 2024 | 1.13 |
| 2023 | 1.32 |
| 2022 | 0.88 |
| 2021 | 0.68 |
📈 Dividend Growth
Dividend growth is a crucial metric, reflecting the company's ability to increase shareholder returns over time and indicating the potential for income growth for investors seeking stable and growing dividends.
| Time | Growth |
|---|---|
| 3 years | 18.45% |
| 5 years | 16.79% |
The average dividend growth is 16.79% over 5 years. This shows moderate but steady dividend growth, reassuring for income-dependent investors.
📉 Payout Ratio
Payout ratios are key indicators of a company's ability to sustain dividend payments, reflecting income compatibility with cash flows and earnings. High payout ratios can signal potential risk if not supported by earnings growth.
| Key Figure | Ratio |
|---|---|
| EPS-based | 126.57% |
| Free cash flow-based | 76.79% |
While an EPS-based payout ratio of 126.57% suggests overextension, a FCF payout ratio of 76.79% indicates a relatively healthier, albeit aggressive, dividend coverage from cash flows.
✅ Cashflow & Capital Efficiency
| Metric | 2024 | 2023 | 2022 |
|---|---|---|---|
| Free Cash Flow Yield | 4.40% | 4.24% | 4.51% |
| Earnings Yield | 2.32% | 2.49% | 2.12% |
| CAPEX to Operating Cash Flow | 20.28% | 19.97% | 20.33% |
| Stock-based Compensation to Revenue | 1.07% | 1.21% | 1.29% |
| Free Cash Flow / Operating Cash Flow Ratio | 79.72% | 80.03% | 79.67% |
Analyzing cash flow elements showcases the firm's capability to sustain operations and reward shareholders, with moderate CAPEX ratios indicating prudent capital spending.
🏢 Balance Sheet & Leverage Analysis
Balance sheet metrics form the backbone of financial stability, allowing companies to withstand market volatility and economic downturns through strong liquidity and manageable debt levels.
| Metric | 2024 | 2023 | 2022 |
|---|---|---|---|
| Debt-to-Equity | 0.84 | 0.84 | 0.75 |
| Debt-to-Assets | 0.44 | 0.44 | 0.42 |
| Debt-to-Capital | 0.46 | 0.46 | 0.43 |
| Net Debt to EBITDA | 5.23 | 5.13 | 5.66 |
| Current Ratio | 0.82 | 5.71 | 3.41 |
| Quick Ratio | 0.82 | 5.71 | 3.41 |
| Financial Leverage | 1.92 | 1.89 | 1.80 |
The leverage metrics present a highly levered balance sheet, with modest liquidity ratios pointing towards heightened financial obligations and a focus on cash flow garnishment.
🧮 Fundamental Strength & Profitability
Fundamentals convey the intrinsic strength and efficiency of the firm's operations, determining its ability to generate profit and reward shareholders sustainably.
| Metric | 2024 | 2023 | 2022 |
|---|---|---|---|
| Return on Equity | 4.65% | 5.11% | 3.72% |
| Return on Assets | 2.43% | 2.70% | 2.07% |
| Net Margin | 17.33% | 21.36% | 17.13% |
| EBIT Margin | 31.37% | 35.13% | 30.78% |
| EBITDA Margin | 58.64% | 62.85% | 59.29% |
| Gross Margin | 59.04% | 59.87% | 60.94% |
| Research & Development to Revenue | 0% | 0% | 0% |
Strong fundamental parameters, albeit with some margin contraction, reflect operational efficiency and the capability to maintain profitability, essential for shareholder value enhancement.
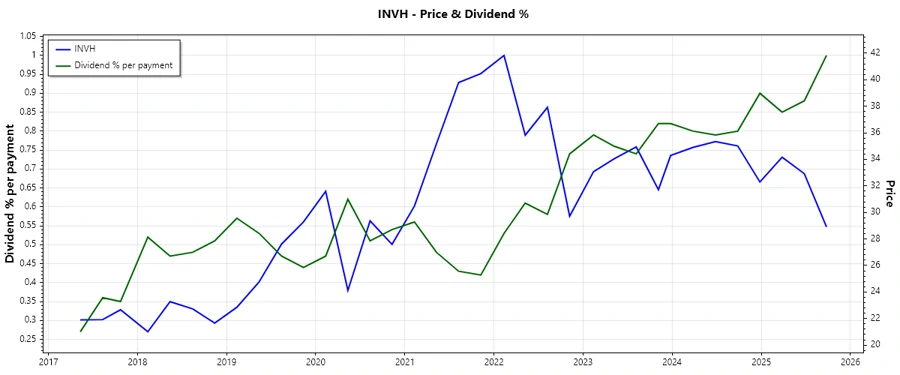
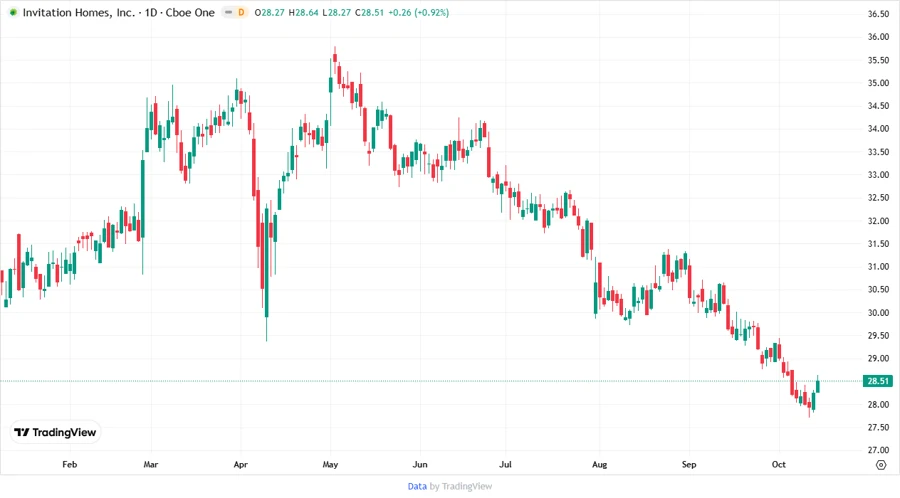
📈 Price Development
📊 Dividend Scoring System
| Criterion | Details | Score |
|---|---|---|
| Dividend yield | 4.01% | |
| Dividend Stability | Higher due to 9 years stability | |
| Dividend Growth | 16.79% over 5 years | |
| Payout Ratio | 126.57% (EPS) & 76.79% (FCF) | |
| Financial Stability | Moderate leverage | |
| Dividend Continuity | Consistent payouts | |
| Cashflow Coverage | Modest coverage | |
| Balance Sheet Quality | Leverage-focused |
Total Score: 31/40
🗣️ Rating
Overall, Invitation Homes Inc. offers solid dividend potential bolstered by a stable history and moderate growth. Despite some concerns about its high payout ratio, the company's steadiness in payments and potential for future income growth make it a prudent choice for long-term dividend investors. We recommend a cautious buy, considering leverage concerns.
Smart Data Insight
Master the Perfect Entry & Exit for this Stock
Don't leave your profits to chance. Historically, this stock follows specific seasonal patterns that institutional traders use to maximize returns.
- ✅ Identify the "Golden Buying Window"
- ✅ Avoid high-risk correction cycles
- ✅ Backtested data from the last 20+ years