March 02, 2026 a 11:31 am


INTU: Dividend Analysis - Intuit Inc.
Intuit Inc. demonstrates a robust dividend profile, characterized by a modest yield and consistent growth over the years. With a stable payout ratio and strong financial metrics, Intuit shows potential for steady income generation. Investors may find the company's reliable dividend history and prudent financial management attractive for long-term holdings.
📊 Overview
Intuit Inc. operates within a resilient sector, offering a moderate dividend yield, which reflects its commitment to shareholder returns while prioritizing growth and innovation.
| Metric | Details |
|---|---|
| Sector | Technology |
| Dividend yield | 1.13 % |
| Current dividend per share | 4.25 USD |
| Dividend history | 16 years |
| Last cut or suspension | None |
🗣️ Dividend History
The longevity of Intuit’s dividend history underscores its commitment to returning value to shareholders. Over 16 years without suspension, the company has demonstrated stability that is pivotal for cautious income-focused investors.
| Year | Dividend per share (USD) |
|---|---|
| 2026 | 2.40 |
| 2025 | 4.32 |
| 2024 | 3.74 |
| 2023 | 3.24 |
| 2022 | 2.82 |
📈 Dividend Growth
Intuit's dividend growth rate reflects its strategic approach to balance growth with shareholder return. Despite sector-specific challenges, its dividends have grown steadily, signifying financial robustness.
| Time | Growth |
|---|---|
| 3 years | 15.28 % |
| 5 years | 14.66 % |
The average dividend growth is 14.66 % over 5 years. This shows moderate but steady dividend growth.
✅ Payout Ratio
The payout ratios assess Intuit's capacity to sustain its dividends from its earnings and free cash flow. It indicates a balance between distributing income to shareholders and retaining earnings for reinvestment.
| Key figure | Ratio |
|---|---|
| EPS-based | 27.30 % |
| Free cash flow-based | 17.29 % |
Intuit's payout ratios being 27.30 % (EPS) and 17.29 % (FCF) highlight a conservative approach, assuring dividend sustainability while preserving cash flows for strategic opportunities.
⚠️ Cashflow & Capital Efficiency
An analysis of Intuit's cash flow and capital efficiency reveals its ability to effectively generate and allocate cash, which is essential for dividend stability and potential growth investments.
| Year | Free Cash Flow Yield | Earnings Yield | CAPEX to Operating Cash Flow | Stock-based Compensation to Revenue | Free Cash Flow / Operating Cash Flow Ratio | Return on Invested Capital |
|---|---|---|---|---|---|---|
| 2025 | 2.77 % | 1.76 % | 2.00 % | 10.45 % | 98 % | 14.78 % |
| 2024 | 2.56 % | 1.63 % | 5.12 % | 11.91 % | 94.88 % | 12.02 % |
| 2023 | 3.33 % | 1.66 % | 5.15 % | 11.92 % | 94.85 % | 10.40 % |
Intuit's cash flow stability and capital return, as shown by its ratios and yields, signify efficient financial management critical for dividend sustainability and future growth.
🧮 Balance Sheet & Leverage Analysis
Evaluating Intuit's leverage and liquidity ratios provides insight into its debt management and financial stability, crucial for sustaining dividends and operational growth.
| Year | Debt-to-Equity | Debt-to-Assets | Debt-to-Capital | Net Debt to EBITDA | Current Ratio | Quick Ratio | Financial Leverage |
|---|---|---|---|---|---|---|---|
| 2025 | 33.68 % | 17.96 % | 25.20 % | 0.64 | 1.36 | 1.36 | 1.87 |
| 2024 | 35.62 % | 20.44 % | 26.26 % | 0.65 | 1.29 | 1.29 | 1.74 |
| 2023 | 38.73 % | 24.08 % | 27.92 % | 0.95 | 1.47 | 1.47 | 1.61 |
Intuit's use of leverage is well-managed, evidenced by positive debt ratios and strong liquidity measures, reflecting solid financial health needed for sustained dividend payments.
📊 Fundamental Strength & Profitability
Intuit's profitability and fundamental metrics are key indicators of its operational efficiency and financial health, impacting its long-term dividend-paying ability.
| Year | ROE | ROA | Net Margin | EBIT Margin | EBITDA Margin | Gross Margin | R&D to Revenue |
|---|---|---|---|---|---|---|---|
| 2025 | 19.63 % | 10.47 % | 20.55 % | 26.98 % | 31.28 % | 80.76 % | 15.55 % |
| 2024 | 16.07 % | 9.22 % | 18.19 % | 23.29 % | 28.13 % | 78.72 % | 16.91 % |
| 2023 | 13.81 % | 8.58 % | 16.59 % | 22.53 % | 28.14 % | 78.13 % | 17.67 % |
With strong margins and returns, Intuit consistently demonstrates high-level profitability, which is essential for sustaining and potentially increasing dividend payouts.
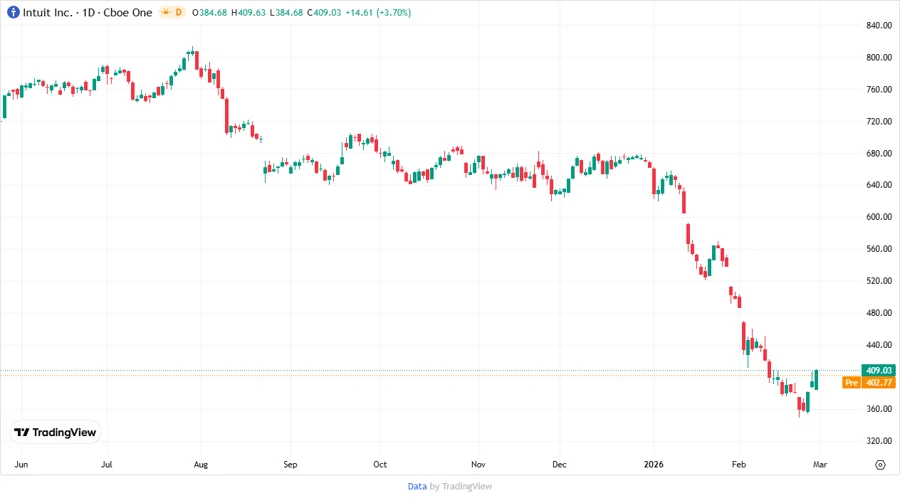
📉 Price Development
Dividend Scoring System
| Category | Score | Score Bar |
|---|---|---|
| Dividend yield | 3 | |
| Dividend Stability | 5 | |
| Dividend growth | 4 | |
| Payout ratio | 4 | |
| Financial stability | 4 | |
| Dividend continuity | 5 | |
| Cashflow Coverage | 4 | |
| Balance Sheet Quality | 4 |
Overall Score: 33/40
⚖️ Rating
Intuit Inc. presents a stable dividend profile with a promising growth trajectory. Despite the modest yield, its strong payout ratio and financial health suggest potential for reliable income. Ideal for investors seeking steady returns from a financially sound company. Recommendation: Buy for Income Stability.