January 03, 2026 a 02:46 am

INTU: Dividend Analysis - Intuit Inc.
Intuit Inc., a leading financial software company, boasts a strong dividend profile despite a modest yield. With 16 consecutive years of dividend payments, the company reflects robust financial health and a commitment to returning value to shareholders. While growth in the dividend yield remains moderate, the consistency highlights stability and reliability, essential traits for long-term investors.
📊 Overview
The overview provides a comprehensive look at Intuit's dividend metrics, revealing insights into its market position and shareholder return capabilities.
| Metric | Value |
|---|---|
| Sector | Technology |
| Dividend yield | 0.71% |
| Current dividend per share | 4.25 USD |
| Dividend history | 16 years |
| Last cut or suspension | None |
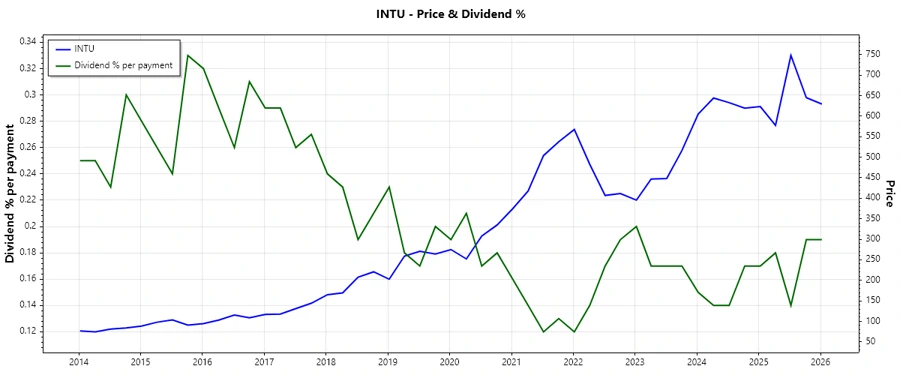
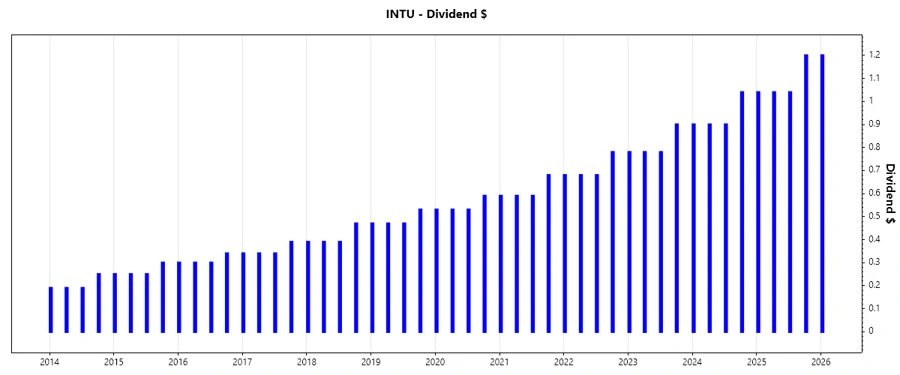
🗣️ Dividend History
Historical dividend data offers a window into the sustainability and growth consistency of returns to shareholders, further indicating the trustworthiness of the management's dividend promises.
| Year | Dividend per Share (USD) |
|---|---|
| 2026 | 1.20 |
| 2025 | 4.32 |
| 2024 | 3.74 |
| 2023 | 3.24 |
| 2022 | 2.82 |
📈 Dividend Growth
Monitoring dividend growth is vital as it signals financial health and the potential for increased future cash flows to shareholders.
| Time | Growth |
|---|---|
| 3 years | 15.28% |
| 5 years | 14.66% |
The average dividend growth is 14.66% over 5 years. This shows moderate but steady dividend growth.
✅ Payout Ratio
Payout ratios are critical as they reflect the proportion of earnings and cash flows dedicated to dividends, hinting at sustainability and potential for reinvestment.
| Key figure | Ratio |
|---|---|
| EPS-based | 28.77% |
| Free cash flow-based | 18.61% |
The EPS payout ratio of 28.77% and FCF payout ratio of 18.61% indicate a well-balanced approach to maintaining dividend outputs while ensuring retained cash for growth.
📉 Cashflow & Capital Efficiency
These metrics illustrate the financial foundation and liquidity of the firm. They are pivotal for ascertaining periods of profitability and uninterrupted dividend coverage.
| Year | 2023 | 2024 | 2025 |
|---|---|---|---|
| Free Cash Flow Yield | 3.33% | 2.56% | 2.77% |
| Earnings Yield | 1.66% | 1.63% | 1.76% |
| CAPEX to Operating Cash Flow | 5.15% | 5.12% | 1.99% |
| Stock-based Compensation to Revenue | 11.92% | 11.91% | 10.45% |
| Free Cash Flow / Operating Cash Flow Ratio | 94.85% | 94.88% | 98.00% |
Intuit's capital efficiency remains strong, evidenced by healthy cash flow yields and stakeholder-friendly capital allocations.
🗣️ Balance Sheet & Leverage Analysis
These ratios illustrate the company's capacity to manage its obligations and sustain operations, keeping financial risks in check.
| Year | 2023 | 2024 | 2025 |
|---|---|---|---|
| Debt-to-Equity | 38.73% | 35.62% | 33.68% |
| Debt-to-Assets | 24.08% | 20.44% | 17.96% |
| Debt-to-Capital | 27.92% | 26.26% | 25.20% |
| Net Debt to EBITDA | 0.95 | 0.65 | 0.64 |
| Current Ratio | 1.47 | 1.29 | 1.36 |
| Quick Ratio | 1.47 | 1.29 | 1.36 |
| Financial Leverage | 1.61 | 1.74 | 1.87 |
The balance sheet remains robust with manageable debt levels, maintaining liquidity to meet short-term obligations and fostering confidence in sustaining dividends.
✅ Fundamental Strength & Profitability
Analyzing fundamental strength and profitability identifies Intuit's ability to generate value for shareholders through well-managed resources and operational efficiency.
| Year | 2023 | 2024 | 2025 |
|---|---|---|---|
| Return on Equity | 13.81% | 16.07% | 19.63% |
| Return on Assets | 8.58% | 9.22% | 10.47% |
| Margins: Net | 16.59% | 18.19% | 20.54% |
| EBIT Margin | 22.53% | 23.29% | 26.98% |
| EBITDA Margin | 28.14% | 28.13% | 31.28% |
| Gross Margin | 78.13% | 78.72% | 80.76% |
| Research & Development to Revenue | 17.67% | 16.91% | 15.55% |
The strong returns and margins underscore Intuit's strategic prowess and resilience in continually improving profitability.
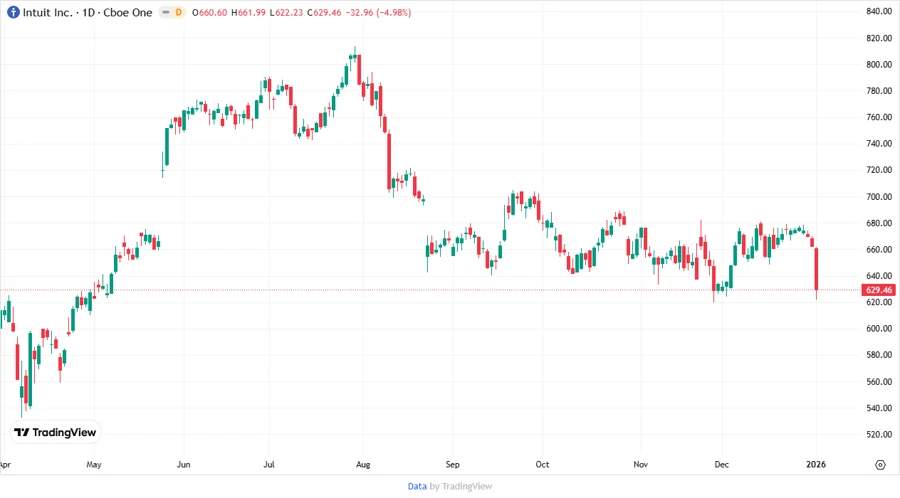
📈 Price Development
🗣️ Dividend Scoring System
| Category | Score | Score Bar |
|---|---|---|
| Dividend yield | 2 | |
| Dividend Stability | 5 | |
| Dividend growth | 3 | |
| Payout ratio | 4 | |
| Financial stability | 5 | |
| Dividend continuity | 5 | |
| Cashflow Coverage | 4 | |
| Balance Sheet Quality | 4 |
Total Score: 32/40
⚠️ Rating
Intuit Inc. demonstrates a strong dividend reliability, characterized by steady historical payouts and responsible financial management. Despite a lower yield, the stability and continuous growth of its dividends make it a reliable choice for long-term dividend investors seeking sustainable income with potential future enhancements.