September 06, 2025 a 12:47 pm


INTU: Dividend Analysis - Intuit Inc.
Intuit Inc. presents a resilient dividend profile marked by consistent growth over the years. With a modest dividend yield complemented by robust financial stability, investors can expect continued enhancement of shareholder value through dividends. The company's disciplined payout ratio ensures sustainability, making it an appealing choice for income-focused investors.
Overview 📊
Intuit Inc., a staple within the technology sector, currently exhibits a modest dividend yield of 0.64% with a dividend per share of $4.25 USD. Sustained dividend growth over 15 years showcases stability, and there has been no dividend cut or suspension, reinforcing investor confidence.
| Metric | Value |
|---|---|
| Sector | Technology |
| Dividend Yield | 0.64% |
| Current Dividend per Share | 4.25 USD |
| Dividend History | 15 years |
| Last Cut or Suspension | None |
Dividend History 📉
Historical dividend data is crucial for assessing the reliability and sustainability of income streams from equities. Intuit Inc.'s consistent dividend payments suggest a stable income opportunity for investors.
| Year | Dividend per Share (USD) |
|---|---|
| 2025 | 4.32 |
| 2024 | 3.74 |
| 2023 | 3.24 |
| 2022 | 2.82 |
| 2021 | 2.45 |
Dividend Growth 📈
Monitoring dividend growth provides insights into a company's capacity to increase payouts and reflects its financial health and sound management strategies. Intuit's steady growth track record suggests continued prospects for dividend enhancements.
| Time | Growth |
|---|---|
| 3 years | 15.14% |
| 5 years | 14.03% |
The average dividend growth is 14.03% over 5 years. This shows moderate but steady dividend growth.
Payout Ratio ✅
An analysis of payout ratios based on earnings and free cash flow is pivotal to understanding the sustainability of dividend payments. Intuit's current metrics suggest a prudent payout strategy.
| Key figure | Ratio |
|---|---|
| EPS-based | 30.62% |
| Free cash flow-based | 19.47% |
The EPS-based payout ratio of 30.62% and the FCF-based ratio of 19.47% are within a sustainable range, suggesting that Intuit maintains a healthy buffer for further investments and potential future dividends.
Cashflow & Capital Efficiency 🗣️
Cash flow metrics highlight the fundamental financial health and capital management efficiency, allowing analyses of operational proficiency and strategic growth potential.
| Year | 2023 | 2024 | 2025 |
|---|---|---|---|
| Free Cash Flow Yield | 3.33% | 2.56% | 2.77% |
| Earnings Yield | 1.66% | 1.63% | 1.76% |
| CAPEX to Operating Cash Flow | 5.15% | 5.12% | 2.00% |
| Stock-based Compensation to Revenue | 11.92% | 11.91% | 10.45% |
| Free Cash Flow / Operating Cash Flow Ratio | 94.85% | 94.88% | 98.00% |
The stability in cash flow and favorable capital efficiency metrics illustrate a strong operational framework, underscoring robust return metrics like ROIC.
Balance Sheet & Leverage Analysis 🗣️
Understanding leverage ratios and balance sheet trends helps in assessing financial exposure and liquidity conditions vital for creditworthiness evaluations.
| Year | 2023 | 2024 | 2025 |
|---|---|---|---|
| Debt-to-Equity | 38.73% | 35.62% | 33.33% |
| Debt-to-Assets | 24.08% | 20.44% | 17.77% |
| Debt-to-Capital | 27.92% | 26.26% | 25.00% |
| Net Debt to EBITDA | 0.95 | 0.65 | 0.63 |
| Current Ratio | 1.47 | 1.29 | 1.36 |
| Quick Ratio | 1.47 | 1.29 | 1.36 |
| Financial Leverage | 1.61 | 1.74 | 1.88 |
Intuit's balance sheet reflects a decreasing leverage trend, indicating strengthening financial health and improved liquidity, conducive to sustaining future growth and stability.
Fundamental Strength & Profitability 📈
Profitability metrics underline operational efficiency and strategic strength, providing insights into the company's competitive positioning.
| Year | 2023 | 2024 | 2025 |
|---|---|---|---|
| Return on Equity | 13.81% | 16.07% | 19.63% |
| Return on Assets | 8.58% | 9.22% | 10.47% |
| Margins: Net | 16.59% | 18.19% | 20.55% |
| Margins: EBIT | 22.53% | 23.29% | 26.98% |
| Margins: EBITDA | 28.14% | 28.13% | 31.28% |
| Margins: Gross | 78.13% | 78.72% | 80.76% |
| Research & Development to Revenue | 17.67% | 16.91% | 15.55% |
The robust profitability metrics display Intuit's operational excellence and strategic foresight, ensuring continuous financial performance improvements and valuable returns.
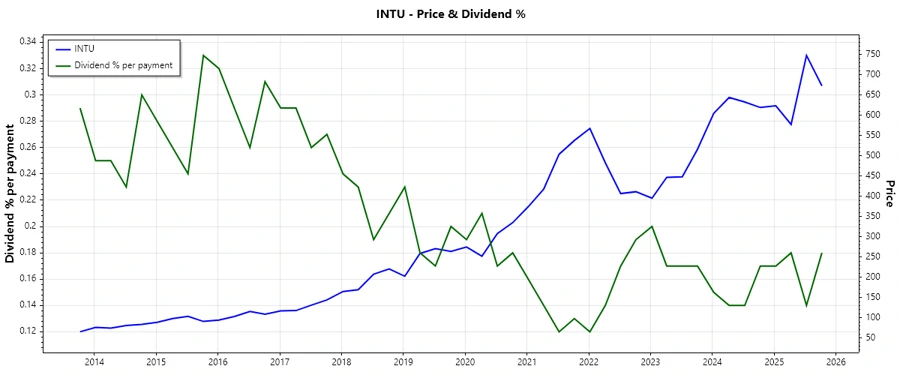
Price Development 📈
Dividend Scoring System 📊
| Category | Score (Out of 5) | Indicator |
|---|---|---|
| Dividend Yield | 3 | |
| Dividend Stability | 5 | |
| Dividend Growth | 4 | |
| Payout Ratio | 4 | |
| Financial Stability | 5 | |
| Dividend Continuity | 5 | |
| Cashflow Coverage | 4 | |
| Balance Sheet Quality | 5 |
Total Score: 35/40
Rating 🏆
Intuit Inc. emerges as a strong dividend-paying entity with robust financial metrics and strategic management capabilities. Its commitment to maintaining and enhancing dividend payouts makes it an ideal investment for those seeking steady income paired with potential for value appreciation. Suitable for moderate risk profiles, Intuit lies as a strong 'Hold' for dividend-focused portfolios.
Smart Data Insight
Master the Perfect Entry & Exit for this Stock
Don't leave your profits to chance. Historically, this stock follows specific seasonal patterns that institutional traders use to maximize returns.
- ✅ Identify the "Golden Buying Window"
- ✅ Avoid high-risk correction cycles
- ✅ Backtested data from the last 20+ years