October 09, 2025 a 03:15 am

INTC: Trend and Support & Resistance Analysis - Intel Corporation
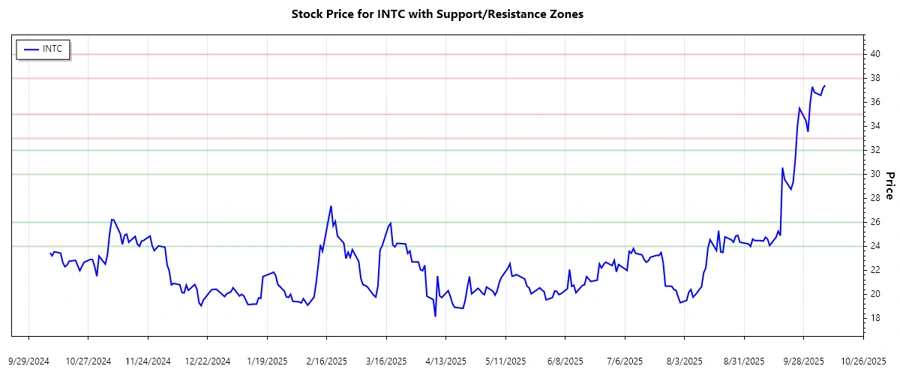
Intel Corporation has witnessed a notable upward journey recently, with its stock showing strength in tackling previous resistance levels. As a leading player in the semiconductor industry, Intel's strategic moves and innovations in AI with partners like MILA bring potential growth opportunities. However, the tech sector's volatility should not be overlooked by investors anticipating steady growth.
Trend Analysis
| Date | Close Price | Trend |
|---|---|---|
| 2025-10-08 | 37.43 | ▲ Upward |
| 2025-10-07 | 37.17 | ▲ Upward |
| 2025-10-06 | 36.59 | ▲ Upward |
| 2025-10-03 | 36.83 | ▲ Upward |
| 2025-10-02 | 37.30 | ▲ Upward |
| 2025-10-01 | 35.94 | ▼ Downward |
| 2025-09-30 | 33.55 | ▼ Downward |
The recent data suggests a strong upward trend as the EMA20 has crossed above the EMA50, signaling investor confidence. This bullish sign indicates potential for further growth.
Support and Resistance
| Zone Type | From | To | |
|---|---|---|---|
| Support | 24.00 | 26.00 | 🟢 Strong |
| Support | 30.00 | 32.00 | 🟢 Moderate |
| Resistance | 38.00 | 40.00 | 🔴 Strong |
| Resistance | 33.00 | 35.00 | 🔴 Moderate |
The current price level is near a resistance zone, potentially posing a hurdle for further upward movement. If breached, it might pave the way for new highs.
Conclusion
The analysis of Intel's stock shows a promising uptrend with recent support from improved market sentiment. As the EMA20 trendline has overtaken the EMA50, investors are likely viewing Intel positively. However, attention should be paid to the current resistance zone, which may temporarily hinder growth. For analysts, these findings indicate a robust momentum albeit with caution as the stock taps into resistance levels.
Smart Data Insight
Master the Perfect Entry & Exit for this Stock
Don't leave your profits to chance. Historically, this stock follows specific seasonal patterns that institutional traders use to maximize returns.
- ✅ Identify the "Golden Buying Window"
- ✅ Avoid high-risk correction cycles
- ✅ Backtested data from the last 20+ years