June 24, 2025 a 01:15 pm


INTC: Trend and Support & Resistance Analysis - Intel Corporation
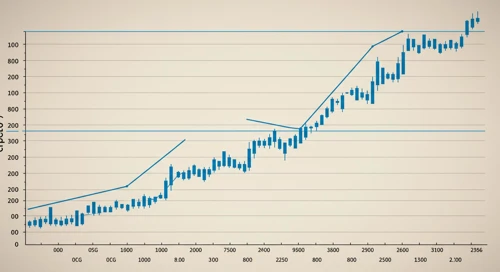
The recent technical analysis of Intel Corporation (INTC) demonstrates a complex trend pattern. The stock has been subject to both upward and downward pressures, creating an environment of volatility. Over the past months, the stock has shown a generally downward trend with intermittent recoveries. Despite the challenges, Intel remains a significant player in the semiconductor industry, potentially offering opportunities for value-oriented investors.
Trend Analysis
By analyzing the daily closing prices for the past several months, we have calculated the EMA20 and EMA50 to determine the prevailing trend. The findings for the last 7 days are as follows:
| Date | Close Price | Trend |
|---|---|---|
| 2025-06-23 | $21.19 | ▲ Up |
| 2025-06-20 | $21.08 | ▼ Down |
| 2025-06-18 | $21.49 | ▲ Up |
| 2025-06-17 | $20.80 | ▼ Down |
| 2025-06-16 | $20.74 | ▼ Down |
| 2025-06-13 | $20.14 | ▼ Down |
| 2025-06-12 | $20.77 | ▲ Up |
Technical analysis indicates a mixed trend with both upward and downward movements over the past week, reflecting a volatile market environment. The calculation of EMA20 and EMA50 suggests a slight downward prevailing trend. The inclusion of these moving averages allows for an effective assessment of momentum and potential directional changes in price movements.
Support and Resistance
The following table illustrates the identified support and resistance zones for Intel Corporation based on recent price data:
| Zone Type | Zone Range |
|---|---|
| Support Zone 1 | ▲ $20.00 - $20.50 |
| Support Zone 2 | ▲ $19.00 - $19.50 |
| Resistance Zone 1 | ▼ $21.50 - $22.00 |
| Resistance Zone 2 | ▼ $22.50 - $23.00 |
Currently, the stock is trading around the support zone of $20.00 - $20.50, indicating a potential reversal area. This can be a pivotal level as breaking below could lead to further declines, whereas a bounce back might signal buying interest. The subsequent levels and market reactions can provide further insights into investor sentiments.
Conclusion
Intel Corporation's stock showcases a challenging landscape characterized by variable trends and deeply ingrained support and resistance levels. Despite the current bearish signals, strategic investors might see opportunities within the lower price zones. A proper evaluation of these technical indicators can offer potential entry points. The data suggests preparing for potential market volatility and closely monitoring these technical levels for strategic decision-making.
Smart Data Insight
Master the Perfect Entry & Exit for this Stock
Don't leave your profits to chance. Historically, this stock follows specific seasonal patterns that institutional traders use to maximize returns.
- ✅ Identify the "Golden Buying Window"
- ✅ Avoid high-risk correction cycles
- ✅ Backtested data from the last 20+ years