
May 26, 2026 a 11:43 am

INTC: Fundamental Ratio Analysis - Intel Corporation
Intel Corporation provides a diverse range of computer products and technologies. The stock currently holds a moderate rating, suggesting there are both growth opportunities and risks associated with it. As the company continues to innovate, particularly in AI and autonomous driving sectors, its market positioning remains crucial.
Fundamental Rating
Intel's fundamental score provides insight into its financial health, competitiveness, and potential long-term performance.
| Category | Score | Visualization |
|---|---|---|
| Overall | 1 | |
| Discounted Cash Flow | 1 | |
| Return On Equity | 1 | |
| Return On Assets | 1 | |
| Debt To Equity | 2 | |
| Price To Earnings | 1 | |
| Price To Book | 3 |
Historical Rating
Review of Intel's recent performance indicators and how they've changed over time.
| Date | Overall Score | DCF | ROE | ROA | D/E | P/E | P/B |
|---|---|---|---|---|---|---|---|
| 2026-05-22 | 1 | 1 | 1 | 1 | 2 | 1 | 3 |
| Previous Date | 0 | 1 | 1 | 1 | 2 | 1 | 3 |
Analyst Price Targets
Analysts provide their expectations on Intel's stock price trajectory over the next year.
| High | Low | Median | Consensus |
|---|---|---|---|
| $150 | $45 | $80 | $84.74 |
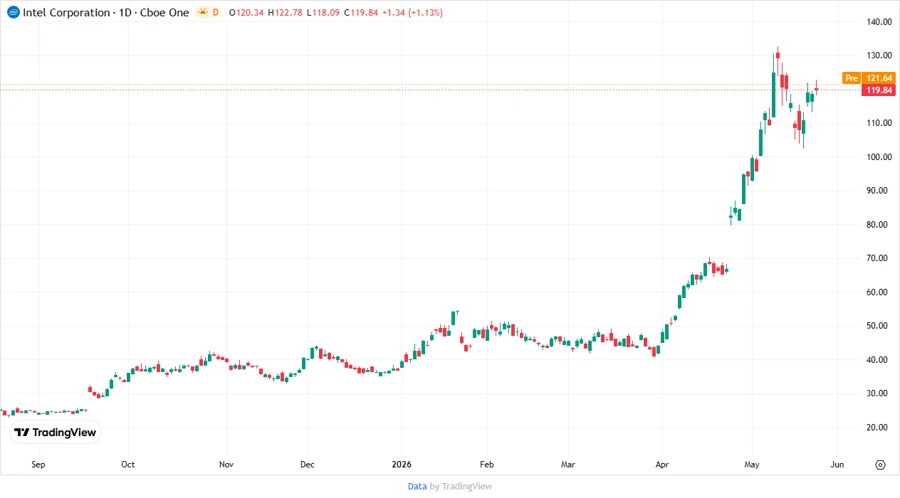
Description: Stock price history and forecast chart for Intel Corporation.
Analyst Sentiments
Overview of analyst recommendations regarding buying, holding, or selling Intel stock.
| Type | Count | Distribution |
|---|---|---|
| Strong Buy | 0 | |
| Buy | 30 | |
| Hold | 45 | |
| Sell | 9 | |
| Strong Sell | 0 |
Conclusion
Intel Corporation has substantial growth potential, notably in AI-driven and autonomous driving sectors. However, current ratings suggest a conservative outlook, as reflected in fundamental scores and analyst price targets. Investors should consider potential risks associated with competitive pressures and market volatility. With strategic partnerships and continued product diversification, Intel remains a key player to watch. Stakeholders should monitor upcoming earnings reports and sector developments for better-informed decisions.
Smart Data Insight
Master the Perfect Entry & Exit for this Stock
Don't leave your profits to chance. Historically, this stock follows specific seasonal patterns that institutional traders use to maximize returns.
- ✅ Identify the "Golden Buying Window"
- ✅ Avoid high-risk correction cycles
- ✅ Backtested data from the last 20+ years