May 20, 2026 a 03:15 pm
INTC: Fibonacci Analysis - Intel Corporation
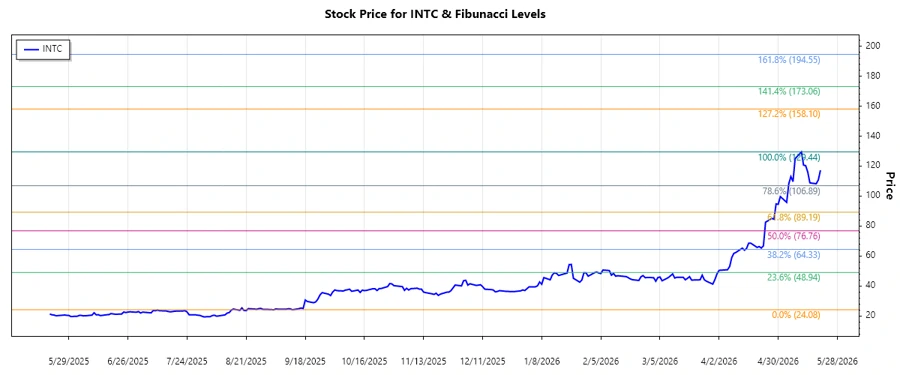
Intel Corporation's stock (INTC) has shown significant volatility over the analyzed timeframe, but a recent dominant uptrend has been observed. Investors are currently eyeing its movements, especially considering its performance against market expectations and ongoing tech sector trends. With its stronghold in diverse computing markets and strategic initiatives such as AI advancements, Intel remains a significant player in the tech industry. Technical analysis indicates potential support and resistance levels that traders should watch closely.
Fibonacci Analysis
| Parameter | Details |
|---|---|
| Trend Start Date | 2025-09-23 |
| Trend End Date | 2026-05-20 |
| High Point Price (Date) | $129.44 (2026-05-11) |
| Low Point Price (Date) | $24.08 (2025-09-12) |
| Fibonacci Levels |
|
| Current Retracement Zone | 0.786 |
| Technical Interpretation | The price is in the 0.786 Fibonacci retracement zone, indicating potential resistance near this level. Traders might expect possible consolidation or a reversal, or await a breakout confirmation. |
Conclusion
Intel Corporation's (INTC) stock has been on a strong upward trend, recently peaking with signs of resistance at key Fibonacci levels. As such, this suggests a pivotal moment for the stock. If it breaks above the $95.35 level, further bullish momentum could be expected. However, failure to do so may lead to a pullback. Analysts view this period as crucial, where investors must weigh the robust fundamental performance of the company against broader market conditions. The potential upside from such a breakout provides significant opportunity, while the downside risk necessitates caution.
Smart Data Insight
Master the Perfect Entry & Exit for this Stock
Don't leave your profits to chance. Historically, this stock follows specific seasonal patterns that institutional traders use to maximize returns.
- ✅ Identify the "Golden Buying Window"
- ✅ Avoid high-risk correction cycles
- ✅ Backtested data from the last 20+ years