December 07, 2025 a 03:15 pm

INTC: Fibonacci Analysis - Intel Corporation
Intel Corporation, a leader in manufacturing computer products, has shown a remarkable price recovery over the last few months. After reaching a low in mid-September 2025, the stock trended upwards, marking new highs. The company's strategic initiatives in artificial intelligence and cloud solutions continue to bolster investor confidence.
Fibonacci Analysis
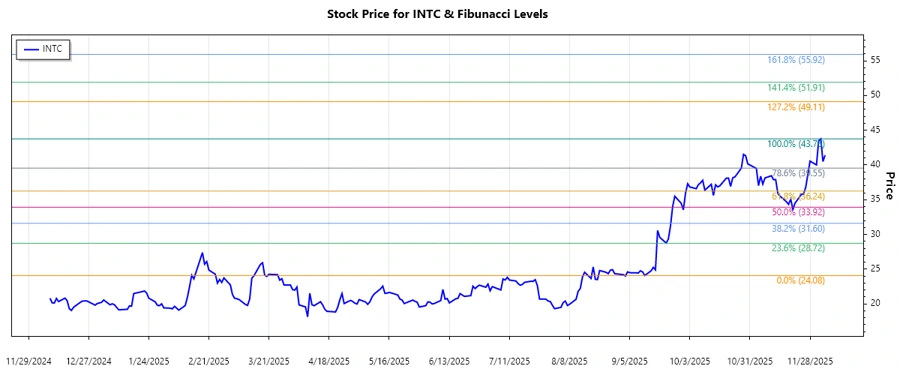
Intel Corporation's stock price demonstrated a significant uptrend starting from mid-September 2025, moving from a low of $24.08 to a recent high of $43.76. During this recovery, the price moved through critical resistance levels, and with the current price resting at $41.41, the stock seems to consolidate just within a crucial retracement level.
| Start Date | End Date | Low Price | High Price |
|---|---|---|---|
| 2025-09-12 | 2025-12-03 | $24.08 | $43.76 |
| Fibonacci Level | Price Level |
|---|---|
| 0.236 | $38.76 |
| 0.382 | $35.76 |
| 0.5 | $33.92 |
| 0.618 | $32.08 |
| 0.786 | $29.36 |
The current price of $41.41 is above the 0.236 Fibonacci retracement level, indicating that the stock has not yet retraced significantly from its peak. Given this analysis, the stock may be finding support near its recent high. A break above the previous high may lead to further upside momentum.
Conclusion
The strong upward trend observed in Intel's stock signifies solid investor confidence and a positive market outlook for the company. However, some caution is warranted as the stock approaches previous high levels, potentially acting as resistance. Analysts should monitor for a potential breakout or consolidation in the coming weeks. Given Intel's ongoing innovations and strategic partnerships, the stock remains an attractive candidate for growth-focused portfolios despite market volatility.