
June 30, 2026 a 03:15 pm

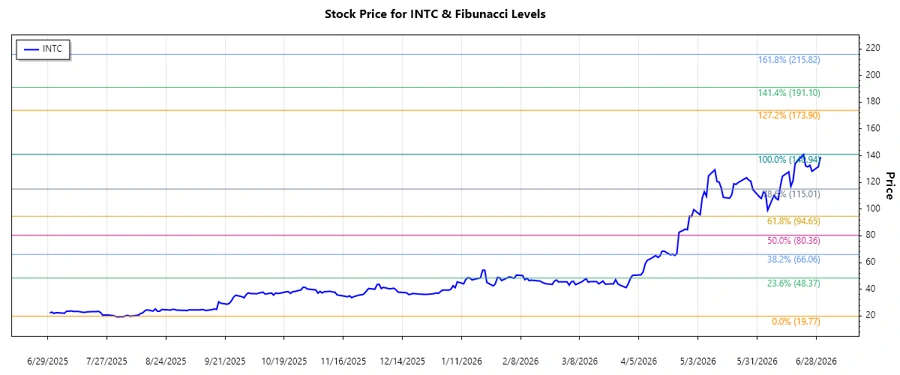
INTC: Fibonacci Analysis - Intel Corp.
The recent trajectory of Intel Corp. shows a significant upward trend after a prolonged period of stability. This upward movement, aided by favorable business developments, indicates strengthened investor confidence. Analysts are optimistic about the company’s potential given its strategic collaborations and as the tech industry continues to evolve, Intel's positioning appears strong. However, as always, market conditions and sector performance must be considered.
Fibonacci Analysis
The detailed analysis of the historical stock prices for Intel Corp. reveals an upward trend starting after a low point in 2025. Utilizing the highest and lowest stock prices from this period forms the basis for the Fibonacci retracement.
| Attribute | Details |
|---|---|
| Trend Analysis Period | Start: 2025-08-07, End: 2026-06-22 |
| Highest Point | Price: $140.94, Date: 2026-06-22 |
| Lowest Point | Price: $19.77, Date: 2025-08-07 |
| Fibonacci Level | Price Level |
|---|---|
| 0.236 | $52.63 |
| 0.382 | $70.49 |
| 0.5 | $80.35 |
| 0.618 | $90.21 |
| 0.786 | $103.57 |
The current stock price is around $139.08, located above all major Fibonacci retracement levels, suggesting the possibility of new resistance areas forming as the stock continues to find a new high. This upward momentum may indicate a strong support base if the stock price retracts to one of the Fibonacci levels.
The chart visualizes the strength of the ongoing uptrend and can assist investors in forming future market expectations.
Conclusion
Intel Corp.'s stock has showcased resilience with an apparent robust upward trend. The stock is positioned above major retracement levels, indicative of a strong bullish sentiment. Investors may consider this positive trajectory as an opportunity, but must remain vigilant given potential sector volatility or macroeconomic shifts. While the risks of a correction exist, the strategic strength of Intel makes it a potential candidate for long-term holders, aligning with broader industry growth dynamics and technological advancements.
Smart Data Insight
Master the Perfect Entry & Exit for this Stock
Don't leave your profits to chance. Historically, this stock follows specific seasonal patterns that institutional traders use to maximize returns.
- ✅ Identify the "Golden Buying Window"
- ✅ Avoid high-risk correction cycles
- ✅ Backtested data from the last 20+ years