
June 08, 2026 a 11:31 am

INTC: Dividend Analysis - Intel Corporation
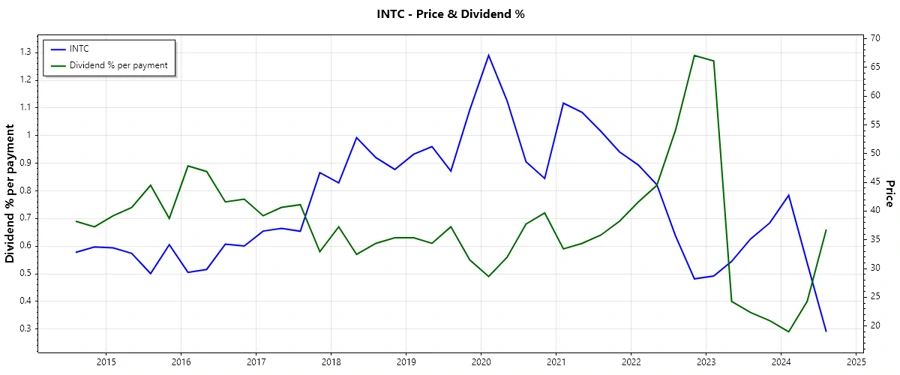
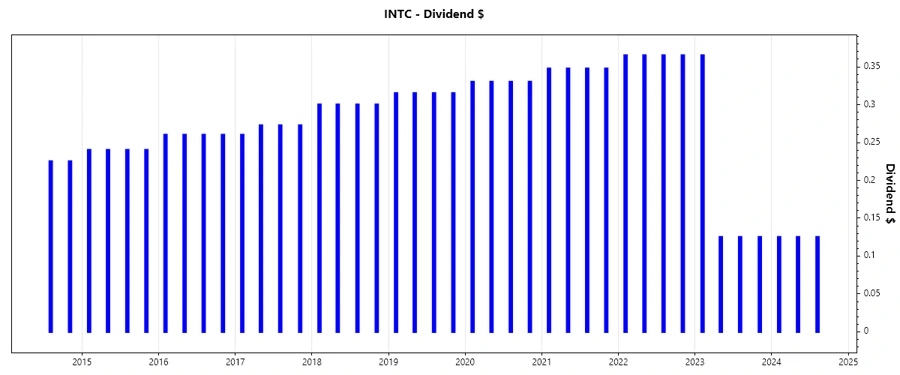
Intel Corporation presents a mixed dividend profile with a current yield of 2.63%. The company's recent suspension of dividends in 2024 raises concerns about future payouts, although its long history of 33 years of dividend issuance exhibits past reliability. Despite recent negative dividend growth, investors might anticipate strategic adjustments to address financial challenges.
📊 Overview
Intel Corporation operates within the highly competitive technology sector. The company has demonstrated a commitment to shareholders with a 33-year history of dividend distributions. However, the last dividend adjustment in 2024 indicates potential volatility in dividend policies.
| Key Metrics | Details |
|---|---|
| Sector | Technology |
| Dividend yield | 2.63% |
| Current dividend per share | 0.00 USD |
| Dividend history | 33 years |
| Last cut or suspension | 2024 |
🗣️ Dividend History
The historical consistency of dividends, now shifting, reflects broader economic and internal pressures. These dynamics underline the necessity for diligent monitoring of dividend patterns in future fiscal periods.
| Year | Dividend Per Share (USD) |
|---|---|
| 2024 | 0.375 |
| 2023 | 0.74 |
| 2022 | 1.46 |
| 2021 | 1.39 |
| 2020 | 1.32 |
📈 Dividend Growth
Recent negative growth in dividends over both 3 and 5-year periods suggests diminishing shareholder returns, further compounded by market conditions impacting business operations.
| Time | Growth |
|---|---|
| 3 years | -0.364% |
| 5 years | -0.223% |
The average dividend growth is -0.223% over 5 years. This shows moderate but negative dividend growth, reflecting challenges within the business environment.
🔍 Payout Ratio
The payout ratio evaluates the portion of EPS and cash flow allocated as dividends, pivotal for assessing financial sustainability. Intel's current EPS and FCF payout ratios are notably zero, indicating a conservative approach amidst recent operational setbacks.
| Key figure | Ratio |
|---|---|
| EPS-based | 0% |
| Free cash flow-based | 0% |
Intel exhibits a 0% payout ratio for both EPS and FCF, suggesting a halt in dividend distributions to preserve cash amidst fiscal challenges.
📑 Cashflow & Capital Efficiency
Effective cash flow management and capital efficiency are crucial for ensuring sustainable financial health, facilitating investments, and supporting operational needs. Observing these indicators offers insights into potential growth trajectories and strategic sustainability.
| Year | 2023 | 2024 | 2025 |
|---|---|---|---|
| Free Cash Flow Yield | -6.78% | -18.02% | -2.82% |
| Earnings Yield | 0.80% | -21.59% | -0.15% |
| CAPEX to Operating Cash Flow | 224.48% | 288.90% | 151.04% |
| Stock-based Compensation to Revenue | 5.95% | 6.42% | 4.61% |
| Free Cash Flow / Operating Cash Flow Ratio | -124.48% | -188.90% | -51.03% |
Analysis reveals fluctuating cash flows, necessitating improved operational efficiencies and strategic financing to enhance capital productivity.
📉 Balance Sheet & Leverage Analysis
An analysis of leverage and liquidity provides critical insights into a firm's financial resilience, flexibility, and risk exposure, significant for financial planning and strategic safeguarding.
| Year | 2023 | 2024 | 2025 |
|---|---|---|---|
| Debt-to-Equity | 46.67% | 50.38% | 40.76% |
| Debt-to-Assets | 25.72% | 25.45% | 22.03% |
| Debt-to-Capital | 31.82% | 33.50% | 28.96% |
| Net Debt to EBITDA | 3.75 | 34.71 | 2.25 |
| Current Ratio | 1.54 | 1.33 | 2.02 |
| Quick Ratio | 1.15 | 0.98 | 1.64 |
| Financial Leverage | 1.81 | 1.98 | 1.85 |
Intel's leverage metrics underscore the need for careful management to stabilize debt levels while capitalizing on growth opportunities.
✅ Fundamental Strength & Profitability
Profitability ratios and fundamental strength are essential in evaluating operational success and sustainable growth potential, with an emphasis on maintaining robust margins crucial for navigating economic shifts.
| Year | 2023 | 2024 | 2025 |
|---|---|---|---|
| Return on Equity | 1.60% | -18.89% | -0.23% |
| Return on Assets | 0.88% | -9.55% | -0.13% |
| Margins: Net | 3.11% | -35.32% | -0.51% |
| Margins: EBIT | 0.30% | -19.16% | 5.01% |
| Margins: EBITDA | 20.73% | 2.27% | 27.16% |
| Margins: Gross | 40.04% | 32.66% | 34.77% |
| Research & Development to Revenue | 29.59% | 31.16% | 26.06% |
Intel's margins and returns reflect operational pressures, highlighting key challenges in achieving sustainable profitability and innovation-driven growth.
📈 Price Development
🌟 Dividend Scoring System
| Criterion | Score | Indicator |
|---|---|---|
| Dividend yield | 3 | |
| Dividend Stability | 2 | |
| Dividend growth | 1 | |
| Payout ratio | 2 | |
| Financial stability | 2 | |
| Dividend continuity | 1 | |
| Cashflow Coverage | 2 | |
| Balance Sheet Quality | 3 |
Total Score: 16 out of 40
🧐 Rating
While Intel Corporation's long tenure of dividend issuance is commendable, current financial challenges and cessation of dividend growth detract from its attractiveness to dividend-focused investors. Stakeholders should observe the company's strategic pivots for reinvigorating growth and financial health, potentially enhancing future dividend prospects. With a total score of 16 out of 40, Intel reflects moderate potential with significant room for improvement.
Smart Data Insight
Master the Perfect Entry & Exit for this Stock
Don't leave your profits to chance. Historically, this stock follows specific seasonal patterns that institutional traders use to maximize returns.
- ✅ Identify the "Golden Buying Window"
- ✅ Avoid high-risk correction cycles
- ✅ Backtested data from the last 20+ years