March 02, 2026 a 02:46 am

INTC: Dividend Analysis - Intel Corporation
The current dividend analysis for Intel Corporation reveals a complex picture. With a recent dividend cut and suspension in 2024, signaling financial reevaluation, the company is navigating a challenging environment. Despite a long history of dividend payments spanning 33 years, the dividend growth has been negative over the past three to five years. Financial metrics such as payout ratios suggest a cautious outlook, demanding keen attention from investors.
Overview 📊
Intel Corporation, a leading player in the Tech sector, currently offers a dividend yield of 2.63%. Despite the attractive yield, the suspension of dividends in 2024 marks a strategic reconsideration of capital allocation priorities. The dividend history is robust with 33 years of payments indicating a traditionally shareholder-friendly policy.
| Parameters | Details |
|---|---|
| Sector | Technology |
| Dividend yield | 2.63 % |
| Current dividend per share | 0 USD |
| Dividend history | 33 years |
| Last cut or suspension | 2024 |
Dividend History 📈
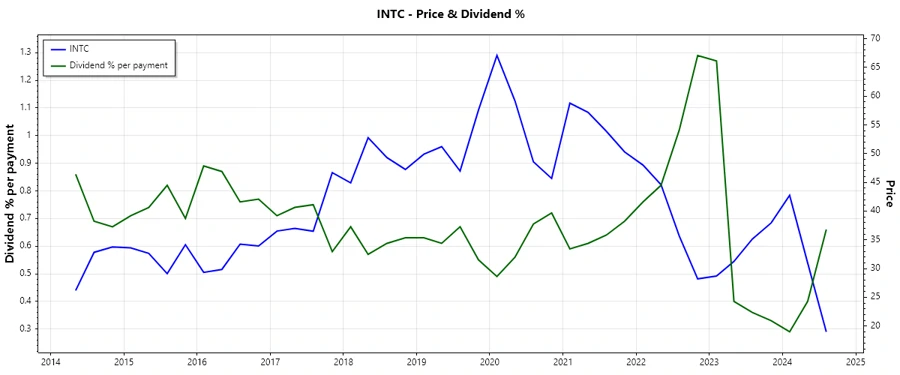
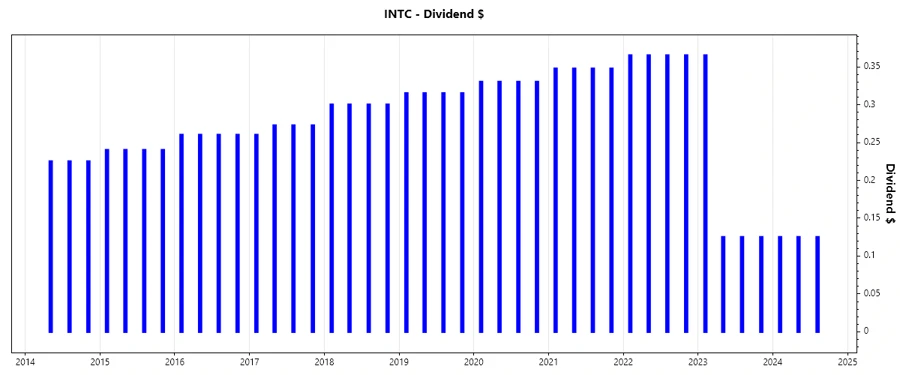
Understanding the dividend history of Intel Corporation casts light on its shareholder value distribution strategy. Despite a recent suspension, the prolonged payment history is indicative of sustained financial health up to 2023.
| Year | Dividend Per Share (USD) |
|---|---|
| 2024 | 0.375 |
| 2023 | 0.740 |
| 2022 | 1.460 |
| 2021 | 1.39 |
| 2020 | 1.32 |
Dividend Growth 📉
Reviewing dividend growth over the last few years reveals negative trends with a -0.36% over 3 years and -0.22% over 5 years. While disappointing, this signals a strategic shift possibly aligning with broader business goals in a volatile tech environment.
| Time | Growth |
|---|---|
| 3 years | -0.36 % |
| 5 years | -0.22 % |
The average dividend growth is -0.22% over 5 years. This shows moderate but steady dividend growth fluctuating due to external pressures.
Payout Ratio ✅
The payout ratios for Intel Corporation indicate a conservative distribution approach with both EPS-based and FCF-based payout ratios at 0%, reflecting the recent dividend suspension and indicating a focus on bolstering capital reserves amid a complex market landscape.
| Key figure ratio | |
|---|---|
| EPS-based | 0 % |
| Free cash flow-based | 0 % |
The 0% EPS and FCF payout ratios suggest withholding of cash intended for future reinvestment and risk mitigation.
Cashflow & Capital Efficiency ⚠️
Intel's cash flow metrics signal potential turbulence. The negative free cash flow yield and suboptimal capital distribution ratios emphasize the need for robust internal realignments.
| Metric | 2025 | 2024 | 2023 |
|---|---|---|---|
| Free Cash Flow Yield | -2.82 % | -18.02 % | -6.78 % |
| Earnings Yield | -0.15 % | -21.59 % | 0.80 % |
| CAPEX to Operating Cash Flow | 151.04 % | 288.89 % | 224.48 % |
| Stock-based Compensation to Revenue | 4.61 % | 6.42 % | 5.95 % |
| Free Cash Flow / Operating Cash Flow Ratio | -51.04 % | -188.89 % | -124.48 % |
The cash flow configurations reveal inefficiencies and need for internal fiscal discipline to achieve capital gains sustainability.
Balance Sheet & Leverage Analysis 🗣️
Intel's balance sheet indicates leveraged dynamics with high debt-to-equity ratios. The leverage positions imply potential constraints on operational expansion without external funding support.
| Metric | 2025 | 2024 | 2023 |
|---|---|---|---|
| Debt-to-Equity | 40.76 % | 50.38 % | 46.67 % |
| Debt-to-Assets | 22.03 % | 25.45 % | 25.72 % |
| Debt-to-Capital | 28.96 % | 33.50 % | 31.82 % |
| Net Debt to EBITDA | 2.25 | 34.71 | 3.75 |
| Current Ratio | 2.02 | 1.33 | 0 |
| Quick Ratio | 1.65 | 0.98 | 1.15 |
| Financial Leverage | 1.85 | 1.98 | 1.81 |
Financial firmness is compromised, indicating urgent need for reduction of leverage to nurture business resilience.
Fundamental Strength & Profitability 📈
Intel's profitability metrics are a mixed bag with concerning deficits in asset utilization ratios. Margins demonstrate an aggressive revenue maintenance strategy that conflicts with realized profitability levels.
| Metric | 2025 | 2024 | 2023 |
|---|---|---|---|
| Return on Equity | -0.23 % | -18.89 % | 1.60 % |
| Return on Assets | -0.13 % | -9.55 % | 0.88 % |
| Margins: Net | -0.51 % | -35.32 % | 3.11 % |
| EBIT Margin | 5.01 % | -19.16 % | 3.02 % |
| EBITDA Margin | 27.16 % | 2.27 % | 20.73 % |
| Gross Margin | 34.77 % | 32.66 % | 40.04 % |
| Research & Development to Revenue | 26.06 % | 31.16 % | 29.59 % |
Fundamental metrics suggest a need for improvement in asset efficiency to support long-term profitability goals.
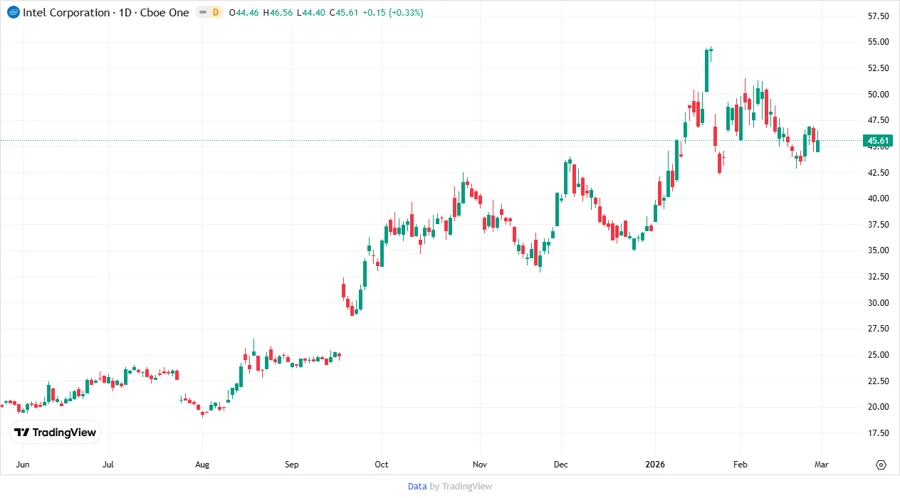
Price Development
Dividend Scoring System ✅
| Criteria | Score | Scale |
|---|---|---|
| Dividend yield | 3 | |
| Dividend Stability | 2 | |
| Dividend growth | 1 | |
| Payout ratio | 3 | |
| Financial stability | 2 | |
| Dividend continuity | 1 | |
| Cashflow Coverage | 2 | |
| Balance Sheet Quality | 2 |
Total Score: 16/40
Rating 💡
Intel Corporation presents a complex investment profile, characterized by a recovering financial framework and transitional dividend policies. Investors may consider maintaining a cautious stance, evaluating resilience potential and revenue expansion strategies.
Smart Data Insight
Master the Perfect Entry & Exit for this Stock
Don't leave your profits to chance. Historically, this stock follows specific seasonal patterns that institutional traders use to maximize returns.
- ✅ Identify the "Golden Buying Window"
- ✅ Avoid high-risk correction cycles
- ✅ Backtested data from the last 20+ years