July 06, 2025 a 03:31 pm

INTC: Dividend Analysis - Intel Corporation
Intel Corporation (INTC) presents a mixed dividend profile. While the company's dividend yield stands at a respectable 2.63%, investors should be cautious due to the recent reduction in dividend payouts. With a long-standing history of 33 years in dividend payments, the latest suspension in 2024 raises questions about the company's ability to maintain its dividend policy amidst financial challenges.
📊 Overview
Intel operates in the Technology sector, historically known for lower dividend payouts but significant reinvestment opportunities. The current dividend yield of 2.63% is complemented by a dividend per share of 0.37 USD. Intel has established a strong 33-year history of dividend payouts, however, the recent dividend cut in 2024 signifies potential financial adjustments.
| Category | Details |
|---|---|
| Sector | Technology |
| Dividend Yield | 2.63% |
| Current Dividend per Share | 0.37 USD |
| Dividend History | 33 years |
| Last Cut or Suspension | 2024 |
🗣️ Dividend History
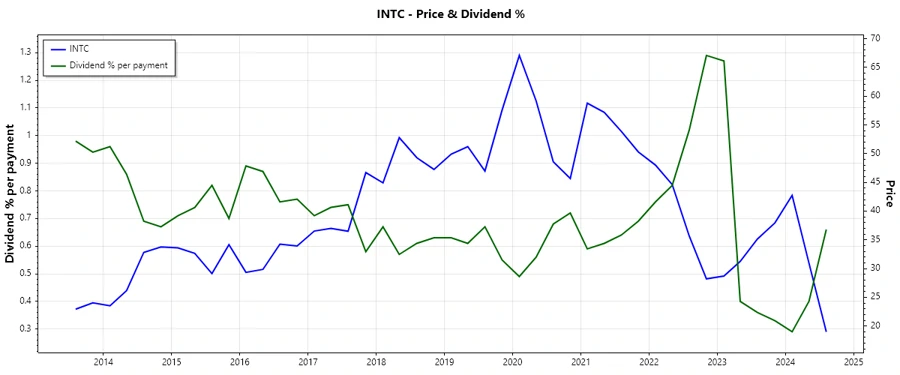
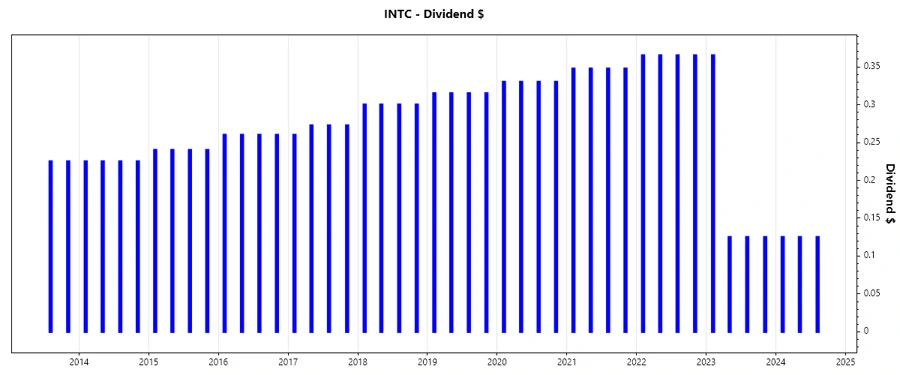
Understanding Intel's dividend history provides valuable insight into the company's commitment to shareholder returns. With a legacy of over three decades, Intel's consistency is significant, though the 2024 cut underscores potential headwinds. Patterns in historical payments often reflect financial health and strategic priorities.
| Year | Dividend per Share (USD) |
|---|---|
| 2024 | 0.375 |
| 2023 | 0.740 |
| 2022 | 1.460 |
| 2021 | 1.390 |
| 2020 | 1.320 |
📈 Dividend Growth
Examining dividend growth reveals Intel's strategy in enhancing shareholder value over time. Despite negative growth over 3 and 5 years, these figures highlight recent struggles but are crucial for grasping long-term viability. While slight may indicate challenges, negative trajectories may affect confidence.
| Time | Growth |
|---|---|
| 3 years | -0.35% |
| 5 years | -0.21% |
The average dividend growth is -0.21% over 5 years. This indicates moderate challenges yet denotes caution for potential investors.
⚠️ Payout Ratio
Payout ratios, crucial for sustainability, highlight earnings and cash flow priorities. Intel's EPS-based ratio at -8.45% and FCF-based at -12.69% underscore financial headwinds. Negative ratios often necessitate strategic pivots to maintain dividend frameworks consistently.
| Key figure | Ratio |
|---|---|
| EPS-based | -8.45% |
| Free cash flow-based | -12.69% |
The current payout ratios suggest earnings inadequacy to cover dividends solely from generated profits, potentially compromising future payouts unless rectified.
✅ Cashflow & Capital Efficiency
Cashflow analysis delves into operational sustainability and strategic capital deployment. Free cash yield at -13.08% signals liquidity inadequacies, while ratios reveal potential restructuring necessity to bolster economic efficiencies.
| Year | 2024 | 2023 | 2022 |
|---|---|---|---|
| Free Cash Flow Yield | -18.02% | -6.78% | -8.86% |
| Earnings Yield | -21.59% | 0.80% | 7.38% |
| CAPEX to Operating Cash Flow | 2.89 | 2.24 | 1.62 |
| Stock-based Compensation to Revenue | 6.42% | 5.95% | 4.96% |
| Free Cash Flow / Operating Cash Flow Ratio | -1.89 | -1.24 | -0.62 |
The negative cash flow dynamics suggest significant operational revamps are necessary to ensure long-term capital efficiency and stability, enhancing long-term investor confidence.
📉 Balance Sheet & Leverage Analysis
Examining leverage and balance health portrays Intel's financial fitness, indicative of risk thresholds. Debt dynamics demand strategic financing maneuvers to uphold fiscal resilience and reduce leverage costs sustainably.
| Year | 2024 | 2023 | 2022 |
|---|---|---|---|
| Debt-to-Equity | 0.50 | 0.47 | 0.41 |
| Debt-to-Assets | 0.25 | 0.26 | 0.23 |
| Debt-to-Capital | 0.34 | 0.32 | 0.29 |
| Net Debt to EBITDA | 34.71 | 3.75 | 1.98 |
| Current Ratio | 1.31 | 1.54 | 1.57 |
| Quick Ratio | 0.98 | 1.15 | 1.16 |
| Financial Leverage | 1.98 | 1.81 | 1.80 |
Intel's leverage ratios, while consistent, underscore the necessity for strategic capital structuring to bolster liquidity positions and operational resilience in volatile market conditions.
✅ Fundamental Strength & Profitability
Profitability insights depict operational proficiency. Despite negative returns, operational improvements remain pivotal. Research & Development investments illustrate commitment to innovation but necessitate concurrent growth in ROI metrics to realize profitability potential.
| Year | 2024 | 2023 | 2022 |
|---|---|---|---|
| Return on Equity | -18.89% | 1.60% | 7.90% |
| Return on Assets | -9.55% | 0.88% | 4.40% |
| Margins: Net | -35.32% | 3.11% | 12.71% |
| Margins: EBIT | -19.16% | 3.02% | 4.08% |
| Margins: EBITDA | 2.27% | 20.73% | 24.76% |
| Margins: Gross | 32.66% | 40.04% | 42.61% |
| R&D to Revenue | 31.16% | 29.59% | 27.80% |
R&D investments, while commendable, should translate to improved efficiency in core profitability metrics, supporting broader financial momentum.
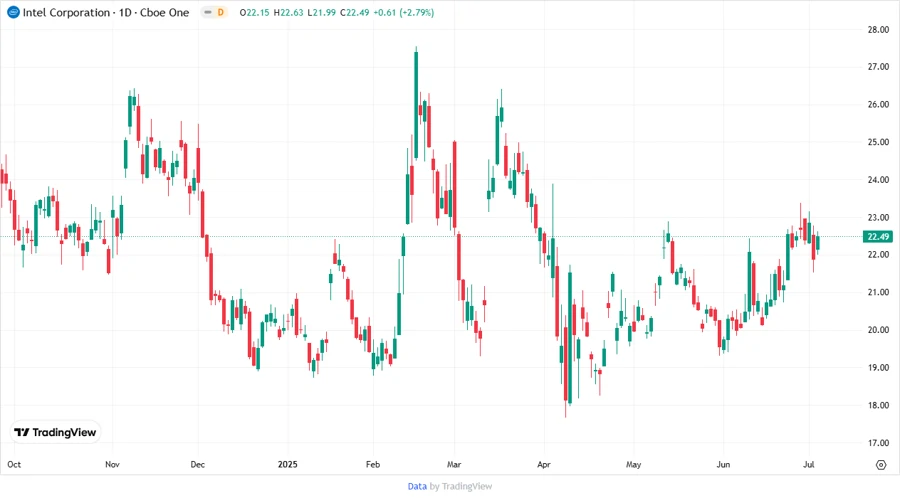
📉 Price Development
🗠 Dividend Scoring System
| Criterion | Score | Score Bar |
|---|---|---|
| Dividend Yield | 4 | |
| Dividend Stability | 2 | |
| Dividend Growth | 1 | |
| Payout Ratio | 2 | |
| Financial Stability | 3 | |
| Dividend Continuity | 2 | |
| Cashflow Coverage | 1 | |
| Balance Sheet Quality | 3 |
Total Score: 18/40
📈 Rating
Intel's dividend profile is undermined by recent cuts and negative growth trends, suggesting caution. While the yield is commendable, ongoing financial restructuring is vital for sustainable capital returns. Investors should remain vigilant regarding Intel's strategic pivots that may influence profitability and dividend consistency.
Smart Data Insight
Master the Perfect Entry & Exit for this Stock
Don't leave your profits to chance. Historically, this stock follows specific seasonal patterns that institutional traders use to maximize returns.
- ✅ Identify the "Golden Buying Window"
- ✅ Avoid high-risk correction cycles
- ✅ Backtested data from the last 20+ years