June 30, 2026 a 07:46 am

INTC: Dividend Analysis - Intel Corp.
Intel Corp. has experienced fluctuations in its dividend profile, highlighted by recent dividend cuts. A review of key financial metrics reveals challenges in profitability and financial stability, yet the company's enduring market presence signals potential recovery avenues.
📊 Overview
Intel Corp. stands as a major player in the technology sector. Despite the recent dividend cut, the company has maintained a long-standing history of dividend payments over 33 years, showcasing a traditional commitment to shareholders.
| Detail | Value |
|---|---|
| Sector | Technology |
| Dividend yield | 2.63 % |
| Current dividend per share | 0 USD |
| Dividend history | 33 years |
| Last cut or suspension | 2024 |
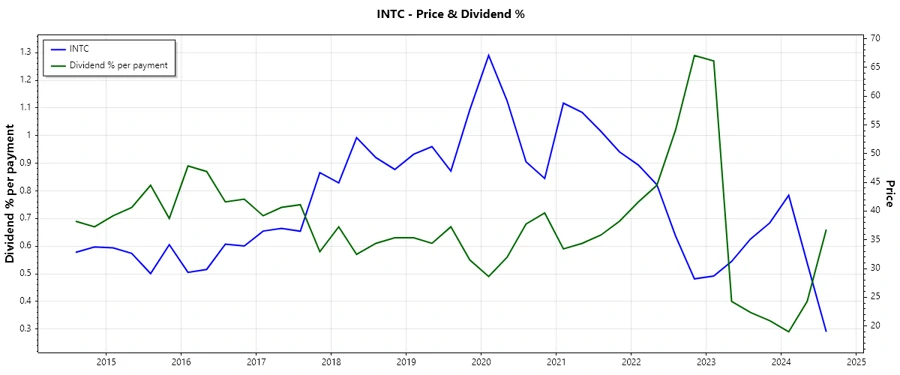
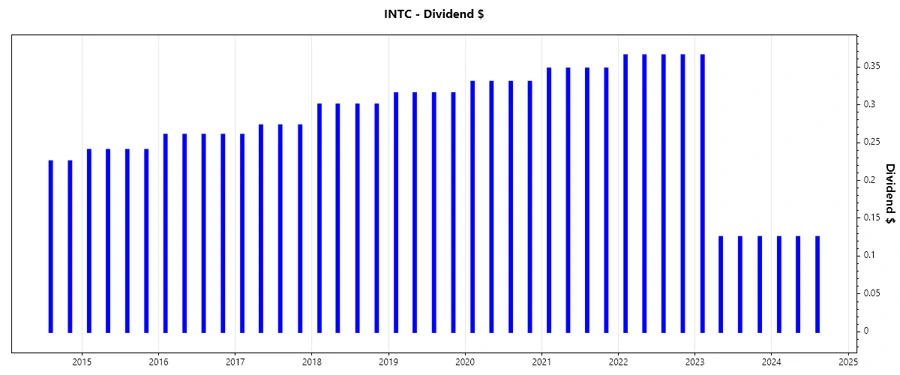
🗣️ Dividend History
Intel Corp.'s recent dividend trajectory has experienced significant modifications. The historical consistency in dividend payouts plays a crucial role in ensuring investor confidence, even amidst financial restructuring or economic downturns.
| Year | Dividend per Share (USD) |
|---|---|
| 2024 | 0.375 |
| 2023 | 0.740 |
| 2022 | 1.460 |
| 2021 | 1.390 |
| 2020 | 1.32 |
📈 Dividend Growth
Monitoring dividend growth provides insight into a company's financial health and long-term viability. The recent negative growth suggests Intel is navigating crucial fiscal challenges.
| Time | Growth |
|---|---|
| 3 years | -0.36 % |
| 5 years | -0.22 % |
The average dividend growth is -0.22 % over 5 years. This shows moderate but steady dividend decline.
📉 Payout Ratio
An assessment of payout ratios is critical when evaluating a company's ability to sustain dividend payments. Intel's zero payout ratios are reflective of its current reinvestment or financial strategy focus.
| Key figure | Ratio |
|---|---|
| EPS-based | 0 % |
| Free cash flow-based | 0 % |
The zero EPS and cash flow-based payout ratios suggest that Intel is currently prioritizing internal investments or addressing deficit issues over shareholder distributions.
✅ Cashflow & Capital Efficiency
Understanding cash flow dynamics assists in gauging a company's operational robustness and future capital allocation. Variability indicates Intel is managing substantial fiscal shifts or strategic reallocation.
| Metric | 2023 | 2024 | 2025 |
|---|---|---|---|
| Free Cash Flow Yield | -0.068 | -0.180 | -0.028 |
| Earnings Yield | 0.008 | -0.216 | -0.002 |
| CAPEX to Operating Cash Flow | 2.245 | 2.889 | 1.510 |
| Stock-based Compensation to Revenue | 0.060 | 0.064 | 0.046 |
| Free Cash Flow / Operating Cash Flow Ratio | -1.245 | -1.889 | -0.510 |
The observed negative cash flow ratios suggest significant cash constraints that could impact future investment flexibility and growth opportunities.
⚠️ Balance Sheet & Leverage Analysis
Balance sheet evaluation offers insights into financial health and structural risk. Intel's ratios depict a cautious stance in leveraging debt alongside maintaining liquidity.
| Metric | 2023 | 2024 | 2025 |
|---|---|---|---|
| Debt-to-Equity | 0.467 | 0.504 | 0.408 |
| Debt-to-Assets | 0.257 | 0.255 | 0.220 |
| Debt-to-Capital | 0.318 | 0.335 | 0.290 |
| Net Debt to EBITDA | 3.754 | 34.715 | 2.252 |
| Current Ratio | 1.542 | 1.327 | 2.017 |
| Quick Ratio | 1.146 | 0.985 | 1.649 |
| Financial Leverage | 1.814 | 1.979 | 1.850 |
The evolving leverage and liquidity ratios indicate shifts in capital structure strategies and a focus on maintaining manageable debt levels.
🔍 Fundamental Strength & Profitability
Evaluating fundamental performance offers visibility into profit potential and operational efficiency. Intel's below-par return metrics and margins suggest a phase of strategic recalibration.
| Metric | 2023 | 2024 | 2025 |
|---|---|---|---|
| Return on Equity | 0.016 | -0.189 | -0.002 |
| Return on Assets | 0.009 | -0.095 | -0.001 |
| Net Margin | 0.031 | -0.353 | -0.005 |
| EBIT Margin | 0.030 | -0.192 | 0.050 |
| EBITDA Margin | 0.207 | 0.023 | 0.272 |
| Gross Margin | 0.400 | 0.327 | 0.348 |
| R&D to Revenue | 0.296 | 0.312 | 0.261 |
The declining margins and negative returns reinforce the pressing need for operational enhancements to return to profitability.
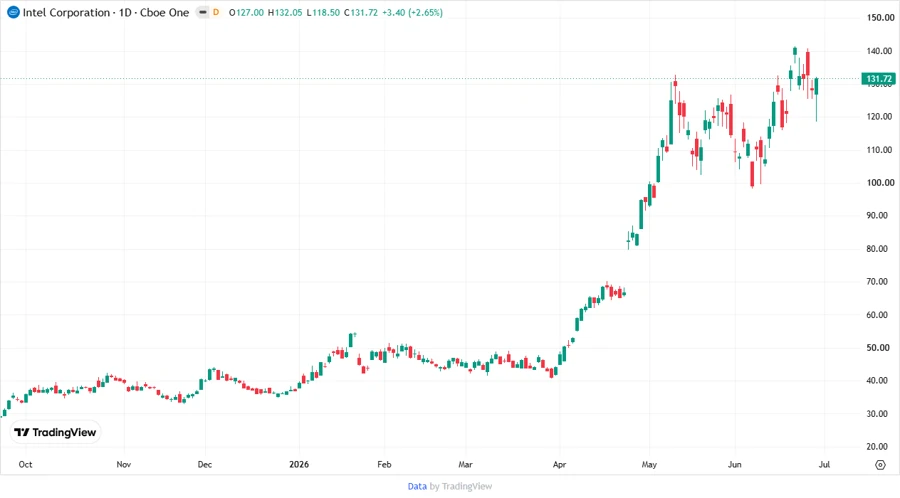
📈 Price Development
💯 Dividend Scoring System
| Criterion | Score | Indicator |
|---|---|---|
| Dividend yield | 2 | |
| Dividend Stability | 1 | |
| Dividend growth | 1 | |
| Payout ratio | 3 | |
| Financial stability | 2 | |
| Dividend continuity | 1 | |
| Cashflow Coverage | 2 | |
| Balance Sheet Quality | 2 |
Total Score: 14/40
✅ Rating
Intel Corp.'s recent performance reflects the complexities within the current tech market landscape. With careful attention to operational improvements and strategic investments, recovery is plausible, yet cautious optimism is advised for potential investors.
Smart Data Insight
Master the Perfect Entry & Exit for this Stock
Don't leave your profits to chance. Historically, this stock follows specific seasonal patterns that institutional traders use to maximize returns.
- ✅ Identify the "Golden Buying Window"
- ✅ Avoid high-risk correction cycles
- ✅ Backtested data from the last 20+ years