March 23, 2026 a 10:15 am

INCY: Fibonacci Analysis - Incyte Corporation
Incyte Corporation's stock has shown significant price movement over the past months. With its proprietary therapeutics, the company continues to hold investor interest. Analyzing recent trends, we observe a dominant upward movement, indicating potential support levels forming post retracement. This analysis aims to uncover critical price levels that could serve as support or resistance.
Fibonacci Analysis
| Parameter | Details |
|---|---|
| Trend Duration | 2026-01-02 to 2026-03-20 |
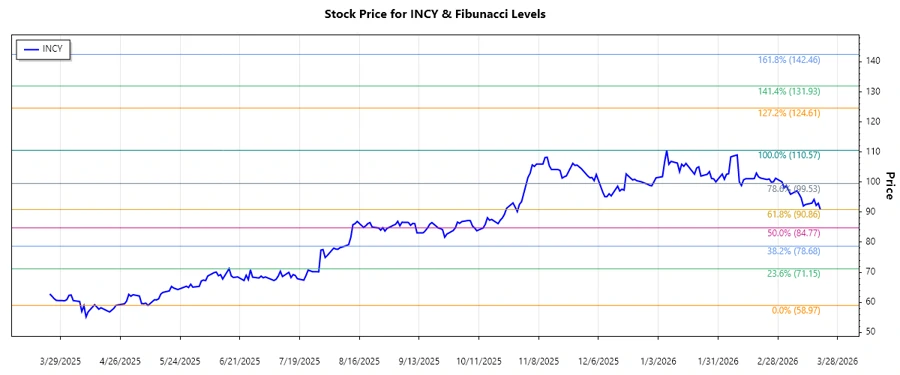
| High Point | $110.57 on 2026-01-07 |
| Low Point | $58.97 on 2025-04-24 |
| Fibonacci Levels |
|
The current price of $90.78 suggests it is within the 0.382 retracement level. This indicates a technical area of potential support, signifying a likely price rebound if bullish behavior persists.
Conclusion
The Incyte Corporation stock showcases resilience with a recent uptrend, largely fueled by promising therapeutic advancements and strategic collaborations. The position within the 0.382 Fibonacci level suggests a strong technical foundation forming around this zone. Bulls might see this as an opportunity to reinforce positions, betting on potential upward targets. However, bears caution on potential resistance should market sentiment or company developments alter. Overall, analysts should remain vigilant on price actions within these key levels, as they could define the near-term trajectory of INCY stock.