
July 11, 2026 a 03:31 am
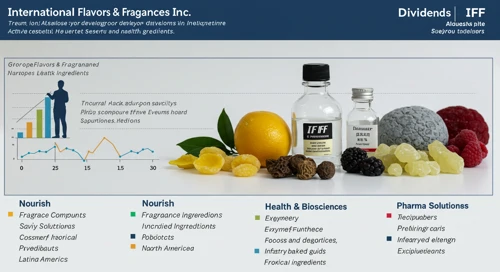


IFF: Dividend Analysis - International Flavors & Fragrances Inc.
International Flavors & Fragrances Inc. (IFF) is known for its strong perseverance in the flavor and fragrance industry, continuously delivering value to its shareholders through its consistent dividend program. Despite some volatility in recent dividend growth rates, the company's lengthy dividend history provides a notable testament to its commitment. This analysis delves into the crucial elements that make up IFF's dividend profile and its financial stance.
📊 Overview
The company operates within a challenging but resilient sector, navigating economic pressures while maintaining its dividend commitments. The following table summarizes key dividend figures for IFF.
| Detail | Value |
|---|---|
| Sector | Ingredients & Specialties |
| Dividend yield | 2.09% |
| Current dividend per share | 1.60 USD |
| Dividend history | 53 years |
| Last cut or suspension | None |
🗣️ Dividend History
IFF boasts a firm dividend history, underscoring its commitment to rewarding shareholders. Historical performance can be indicative of future trends and shareholder trust. Here are the latest dividends paid over recent years.
| Year | Dividend per Share (USD) |
|---|---|
| 2026 | 0.80 |
| 2025 | 1.60 |
| 2024 | 1.60 |
| 2023 | 3.24 |
| 2022 | 3.20 |
📈 Dividend Growth
Dividend growth is a valuable indicator of financial health and management's confidence in the company’s future. Despite recent declines, IFF has demonstrated resilience in its long-standing growth history.
| Time | Growth |
|---|---|
| 3 years | -20.63% |
| 5 years | -12.05% |
The average dividend growth is -12.05% over 5 years. This shows moderate but declining dividend trends.
⚠️ Payout Ratio
The payout ratio is critical as it measures the sustainability of dividends. IFF’s current ratios provide insights into its ability to maintain and possibly grow its dividend distributions.
| Key figure | Ratio |
|---|---|
| EPS-based | 48.00% |
| Free cash flow-based | 102.48% |
With an EPS payout ratio of 48.00%, IFF is managing its earnings to support dividends, but a 102.48% FCF payout ratio signals potential strain on cash reserves.
📉 Cashflow & Capital Efficiency
Consistent cash flow and efficiency in capital utilization are pillars for stable dividend payouts and reinvestment. IFF’s historical data provides an insight into its operational efficiency.
| 2025 | 2024 | 2023 |
|---|---|---|
| Free Cash Flow Yield: 1.48% | 2.78% | 4.53% |
| Earnings Yield: -2.09% | 1.12% | -12.42% |
| CAPEX to Operating Cash Flow: 69.88% | 43.74% | 34.95% |
| Stock-based Compensation to Revenue: 0% | 0.67% | 0.57% |
| Free Cash Flow / Operating Cash Flow ratio: 30.11% | 56.26% | 65.05% |
| ROIC: 3.19% | 2.63% | -7.48% |
FFC and capital efficiency trends show varying performance, with a notable dip impacting potential reinvestment capacity.
✅ Balance Sheet & Leverage Analysis
A robust balance sheet paired with prudent leverage allows a company to weather financial fluctuations. Here we assess IFF’s debt management over recent years.
| 2025 | 2024 | 2023 |
|---|---|---|
| Debt-to-Equity: 0.47 | 0.69 | 0.74 |
| Debt-to-Assets: 0.26 | 0.34 | 0.35 |
| Debt-to-Capital: 0.32 | 0.41 | 0.43 |
| Net Debt to EBITDA: 7.78 | 5.73 | -10.16 |
| Current Ratio: 1.42 | 1.84 | 1.67 |
| Quick Ratio: 0.82 | 1.32 | 0.97 |
| Financial Leverage: 1.80 | 2.07 | 2.12 |
IFF’s leverage and liquidity metrics highlight a cautious approach, although leverage ratios suggest a need for vigilance regarding debt levels.
🔄 Fundamental Strength & Profitability
A company's fundamental health reflects its profitability and strategic effectiveness. IFF’s metrics offer insight into its potential for sustained performance.
| 2025 | 2024 | 2023 |
|---|---|---|
| Return on Equity: -2.55% | 1.75% | -17.55% |
| Return on Assets: -1.41% | 0.85% | -8.28% |
| Margins: Net: -3.31% | 2.12% | -22.35% |
| EBIT: -1.68% | EBITDA: 7.15% | Gross: 36.16% | EBIT: 5.08% | EBITDA: 13.91% | Gross: 35.91% | EBIT: -18.63% | EBITDA: -8.68% | Gross: 32.07% |
| R&D to Revenue: 6.37% | 5.84% | 5.54% |
While IFF maintains competitive gross margins, profitability metrics suggest the need for efficiency improvements to bolster equity returns.
🪙 Price Development
🌟 Dividend Scoring System
| Category | Score | Indicator |
|---|---|---|
| Dividend yield | 3 | |
| Dividend Stability | 4 | |
| Dividend growth | 2 | |
| Payout ratio | 3 | |
| Financial stability | 3 | |
| Dividend continuity | 4 | |
| Cashflow Coverage | 2 | |
| Balance Sheet Quality | 4 |
Total Score: 25 / 40
🗳️ Rating
International Flavors & Fragrances Inc. presents a mixed bag of strengths and challenges. While it maintains a commendable history of dividend continuity, its recent financial performance indicates areas needing strategic attention. Investors should weigh the reliability of dividend payments against the backdrop of evolving market dynamics and potential economic pressures.
Smart Data Insight
Master the Perfect Entry & Exit for this Stock
Don't leave your profits to chance. Historically, this stock follows specific seasonal patterns that institutional traders use to maximize returns.
- ✅ Identify the "Golden Buying Window"
- ✅ Avoid high-risk correction cycles
- ✅ Backtested data from the last 20+ years