
May 25, 2026 a 12:46 pm
IFF: Dividend Analysis - International Flavors & Fragrances Inc.
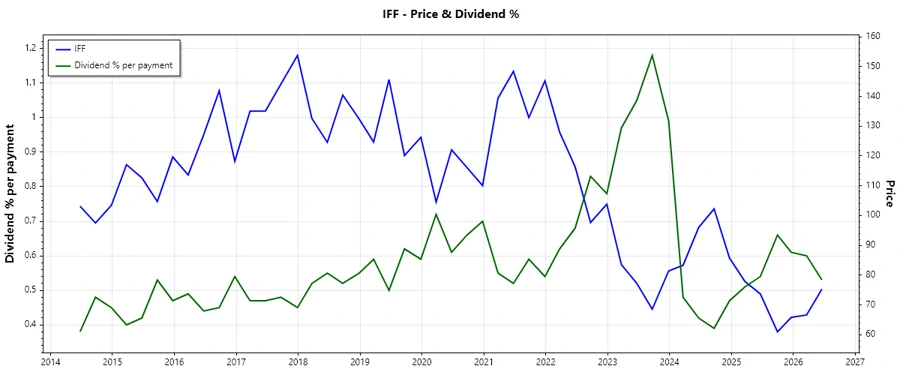
International Flavors & Fragrances Inc. (IFF) presents a unique investment opportunity with its extensive dividend history spanning over 53 years. Despite recent challenges, including decreased dividend growth over the past three to five years, IFF maintains a strong market position in the flavor and fragrance industry. With a competitive dividend yield of 2.13%, this company could appeal to income-focused investors seeking stability.
📊 Overview
Analyze core dividend metrics to understand IFF's dividend strategy within the context of its sector.
| Sector | Dividend Yield | Current Dividend per Share | Dividend History | Last Cut/Suspension |
|---|---|---|---|---|
| Flavor & Fragrance | 2.13% | 1.60 USD | 53 years | None |
🗣️ Dividend History
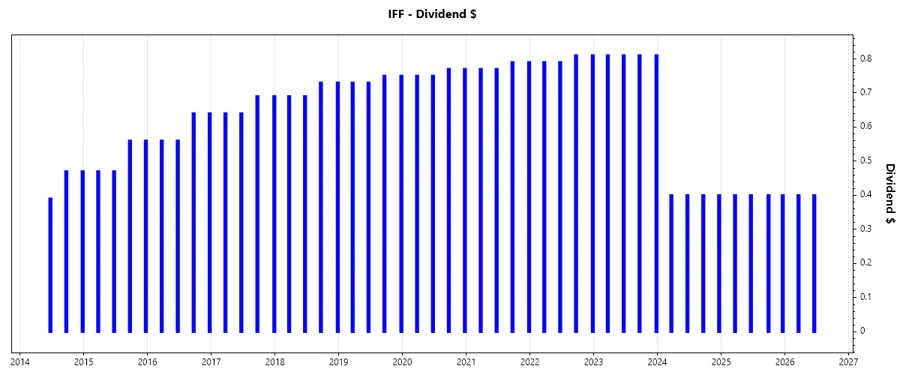
Examining the past five years of dividend payments provides insight into IFF's commitment to shareholder returns and financial management strategies.
Responsive image showing IFF's dividend trends over the past five years
| Year | Dividend per Share (USD) |
|---|---|
| 2026 | 0.80 |
| 2025 | 1.60 |
| 2024 | 1.60 |
| 2023 | 3.24 |
| 2022 | 3.20 |
📈 Dividend Growth
Understanding dividend growth over a multi-year timeframe highlights IFF's ability to increase shareholder value through dividend increases.
| Time | Growth |
|---|---|
| 3 years | -20.63% |
| 5 years | -12.05% |
The average dividend growth is -12.05% over 5 years. This shows a concerning contraction indicating potential financial pressures.
Responsive image illustrating dividend growth trajectory
⚠️ Payout Ratio
The payout ratio indicates how much of IFF's earnings are allocated to dividends, reflecting financial health and sustainability.
| Key figure | Ratio |
|---|---|
| EPS-based | 48.75% |
| Free cash flow-based | 101.97% |
The EPS-based payout ratio is 48.75%, indicating a sustainable dividend policy, while the FCF-based ratio at 101.97% warrants cautious examination.
✅ Cashflow & Capital Efficiency
Analyzing cash flow ratios provides insights into how efficiently IFF converts sales and earnings into cash flow and capital investments.
| Metric | 2023 | 2024 | 2025 |
|---|---|---|---|
| Free Cash Flow Yield | 4.53% | 2.78% | 1.48% |
| Earnings Yield | -12.42% | 1.12% | -2.17% |
| CAPEX to Operating Cash Flow | 34.95% | 43.74% | 69.88% |
| Stock-based Compensation to Revenue | 0.57% | 0.67% | 0% |
| Free Cash Flow / Operating Cash Flow Ratio | 65.05% | 56.26% | 30.12% |
Despite a strong FCF yield historically, recent rising CAPEX costs and declining OCF suggest stress in cash flow utilization.
📉 Balance Sheet & Leverage Analysis
Critical balance sheet ratios indicate IFF's leverage, liquidity, and capacity to meet financial obligations.
| Metric | 2023 | 2024 | 2025 |
|---|---|---|---|
| Debt-to-Equity | 74.07% | 69.33% | 46.99% |
| Debt-to-Assets | 34.94% | 33.56% | 26.04% |
| Debt-to-Capital | 42.55% | 40.95% | 31.96% |
| Net Debt to EBITDA | -10.16 | 5.73 | 7.78 |
| Current Ratio | 1.67 | 1.84 | 1.42 |
| Quick Ratio | 0.97 | 1.32 | 0.82 |
| Financial Leverage | 2.12 | 2.07 | 1.80 |
IFF's leverage has improved in recent years, though challenges are evident, indicating cautious optimism regarding debt management.
✅ Fundamental Strength & Profitability
Assessing margins and return ratios illustrates IFF's profitability and innovation investment levels.
| Metric | 2023 | 2024 | 2025 |
|---|---|---|---|
| Return on Equity | -17.56% | 1.75% | -2.64% |
| Return on Assets | -8.28% | 0.85% | -1.46% |
| Net Margin | -22.35% | 2.12% | -3.43% |
| EBIT Margin | -18.63% | 5.08% | -1.68% |
| EBITDA Margin | -8.68% | 13.92% | 7.15% |
| Gross Margin | 32.07% | 35.91% | 30.95% |
| R&D to Revenue | 5.54% | 5.84% | 6.37% |
Margins reflect recovery avenues in key areas like EBITDA, while broader concerns remain regarding profitability and competitive standing.
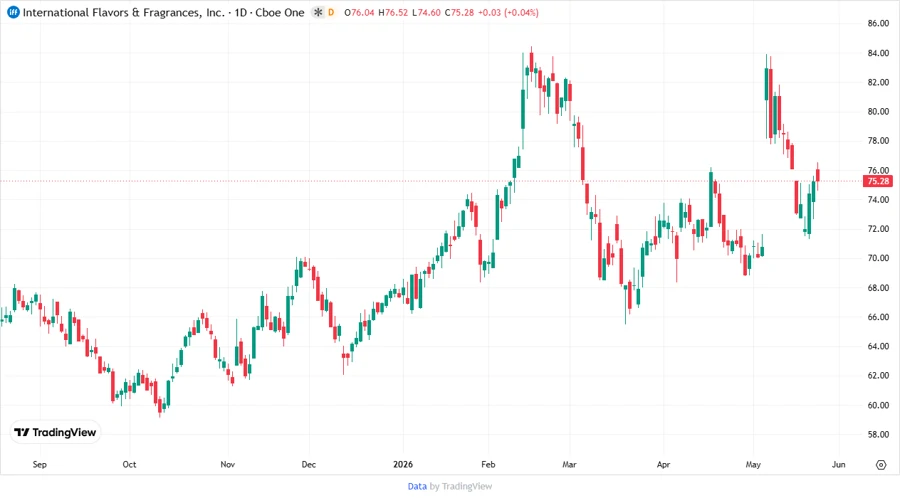
📉 Price Development
Responsive imagery capturing stock price movements during critical years
🗣️ Dividend Scoring System
A critical assessment using a custom dividend scoring system delivers insight into IFF's dividend strategy effectiveness.
| Criterion | Score | Rating |
|---|---|---|
| Dividend Yield | 3 | |
| Dividend Stability | 4 | |
| Dividend Growth | 2 | |
| Payout Ratio | 3 | |
| Financial Stability | 3 | |
| Dividend Continuity | 5 | |
| Cashflow Coverage | 2 | |
| Balance Sheet Quality | 4 |
Total Score: 26 / 40
✅ Rating
International Flavors & Fragrances Inc. displays a resilient dividend profile with a balanced outlook. While historical performance favors its stability and continuity, concerns remain over recent growth trends and cash flow utilization. Investors may view IFF as a dependable option for consistent income, with caution advised for those prioritizing aggressive dividend growth.
Smart Data Insight
Master the Perfect Entry & Exit for this Stock
Don't leave your profits to chance. Historically, this stock follows specific seasonal patterns that institutional traders use to maximize returns.
- ✅ Identify the "Golden Buying Window"
- ✅ Avoid high-risk correction cycles
- ✅ Backtested data from the last 20+ years