January 15, 2026 a 07:32 am

IFF: Dividend Analysis - International Flavors & Fragrances Inc.
International Flavors & Fragrances Inc. (IFF) showcases a storied history of dividend payments, with a legacy spanning over five decades. Despite its venerable track record, recent headwinds have posed challenges, including a reduction in its dividend payout in 2024. A careful analysis is warranted to evaluate the sustainability and potential future growth of its dividend profile.
📊 Overview
The overview of IFF's dividend profile illustrates its grounding in the Consumer Goods sector, showcasing a current dividend yield of 2.43%. Despite a persistent history of 52 years of payout, a notable interruption occurred recently in 2024. This prompts an examination of its dividend policy stability.
| Parameter | Details |
|---|---|
| Sector | Consumer Goods |
| Dividend yield | 2.43 % |
| Current dividend per share | 2.01 USD |
| Dividend history | 52 years |
| Last cut or suspension | 2024 |
📈 Dividend History
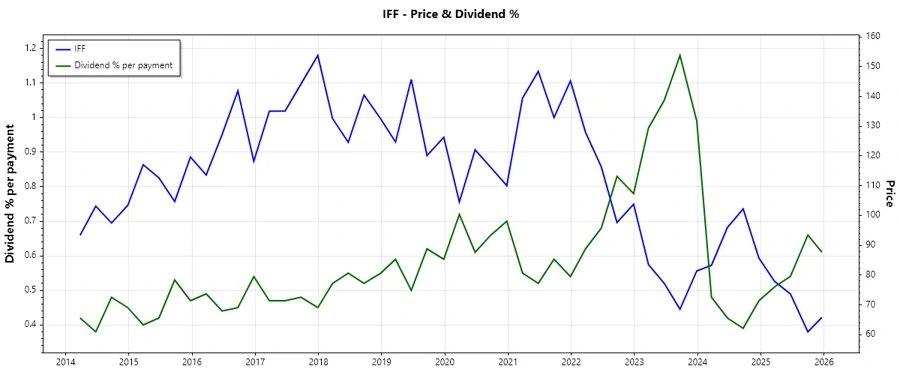
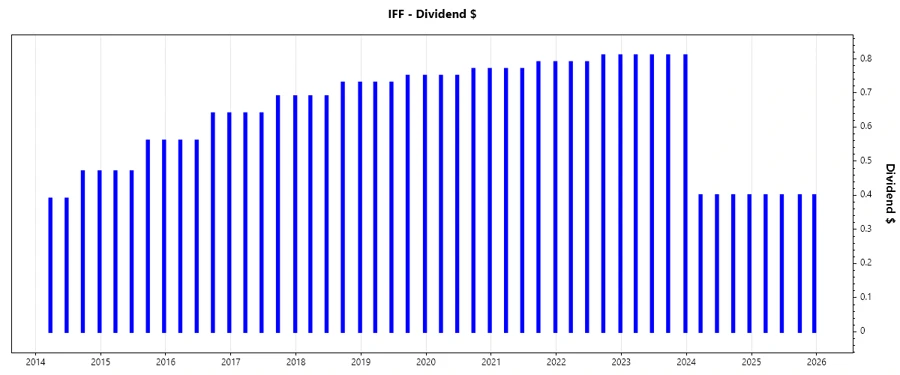
With a history of consistent dividend issuance, IFF's payments have been adjusted over time to reflect market conditions. The recent dividend cut underscores heightened vigilance towards sustainability amidst economic constraints.
The visualization above captures IFF's dividend per share over recent years.
| Year | Dividend per Share (USD) |
|---|---|
| 2025 | 1.60 |
| 2024 | 1.60 |
| 2023 | 3.24 |
| 2022 | 3.20 |
| 2021 | 3.12 |
📉 Dividend Growth
IFF has experienced a negative dividend growth trajectory over the past few years, reflecting -20.63% over 3 years and -12.05% over 5 years. This declining trend signals the potential need for strategic reassessment.
| Time | Growth |
|---|---|
| 3 years | -20.63 % |
| 5 years | -12.05 % |
The average dividend growth is -12.05% over 5 years. This shows declining dividend distributions which could stress shareholder returns.
⚠️ Payout Ratio
The payout ratios are critical indicators of dividend sustainability. IFF's EPS-based payout ratio of -124.76% and FCF-based ratio of 154.88% demonstrate financial stress and potential constraints on dividend coverage.
| Key figure | Ratio |
|---|---|
| EPS-based | -124.76 % |
| Free cash flow-based | 154.88 % |
This inverted EPS and FCF payout ratio highlights challenges in covering dividends through traditional earnings and may signify excessive cash flow utilization.
✅ Cashflow & Capital Efficiency
Analyzing the company's cash flow and capital efficiency gives insight into its internal funding capabilities and long-term value creation.
| Year | 2024 | 2023 | 2022 |
|---|---|---|---|
| Free Cash Flow Yield | 2.78 % | 4.53 % | -0.41 % |
| Earnings Yield | 1.12 % | -12.42 % | -6.99 % |
| CAPEX to Operating Cash Flow | 43.74 % | 34.95 % | 127.46 % |
| Stock-based Compensation to Revenue | 0.67 % | 0.57 % | 0.39 % |
| Free Cash Flow / Operating Cash Flow Ratio | 56.26 % | 65.05 % | -27.46 % |
The variable yields and ratios imply fluctuating capital efficiency, with certain inefficiencies in CAPEX deployment impacting the free cash flow versatility.
🗣️ Balance Sheet & Leverage Analysis
Understanding leverage indicators provides a snapshot of IFF's ability to manage its obligations under different financial operations.
| Year | 2024 | 2023 | 2022 |
|---|---|---|---|
| Debt-to-Equity | 69.34 % | 74.07 % | 66.53 % |
| Debt-to-Assets | 33.56 % | 34.94 % | 33.06 % |
| Debt-to-Capital | 40.95 % | 42.55 % | 39.95 % |
| Net Debt to EBITDA | 5.73 | -10.16 | -102.38 |
| Current Ratio | 1.84 | 1.67 | 1.99 |
| Quick Ratio | 1.32 | 0.97 | 1.11 |
| Financial Leverage | 2.07 | 2.12 | 2.01 |
These metrics reflect a moderate level of financial leverage with manageable obligations but highlight potential liquidity risks and net debt volatility impacting overall leverage.
📊 Fundamental Strength & Profitability
These are essential for assessing the underlying profitability and operational efficiency within IFF's operational framework.
| Year | 2024 | 2023 | 2022 |
|---|---|---|---|
| Return on Equity | 1.75 % | -17.56 % | -10.58 % |
| Return on Assets | 0.85 % | -8.28 % | -5.26 % |
| Net Margin | 2.12 % | -22.35 % | -15.02 % |
| EBIT Margin | 5.08 % | -18.63 % | -10.36 % |
| EBITDA Margin | 13.91 % | -8.68 % | -0.88 % |
| Gross Margin | 35.91 % | 32.07 % | 33.37 % |
| Research & Development to Revenue | 5.84 % | 5.54 % | 4.85 % |
The indicators suggest challenges in profitability, notably influenced by high and rising research and development expenditures and negative returns indicating inefficiencies.
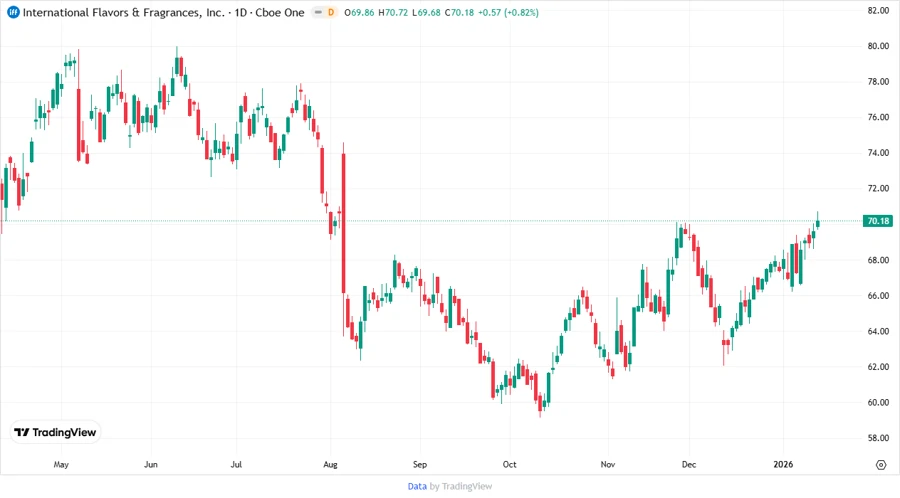
📉 Price Development
The accompanying chart reflects recent movements in IFF's stock price, a key sentiment indicator within markets.
✅ Dividend Scoring System
| Criteria | Score | Bar |
|---|---|---|
| Dividend yield | 3 | |
| Dividend Stability | 2 | |
| Dividend growth | 1 | |
| Payout ratio | 1 | |
| Financial stability | 2 | |
| Dividend continuity | 2 | |
| Cashflow Coverage | 2 | |
| Balance Sheet Quality | 2 |
Total Score: 15/40
🗣️ Rating
The analysis of International Flavors & Fragrances Inc. indicates significant challenges and uncertainties, especially concerning dividend payout stability, negative growth, and financial position. While it remains a historically prominent dividend payer, potential investors should be cautious and perhaps steer towards more stable opportunities with predictable growth and better financial metrics.