December 15, 2025 a 07:31 am
IFF: Dividend Analysis - International Flavors & Fragrances Inc.
International Flavors & Fragrances Inc. (IFF) presents a complex dividend profile characterized by modest current yields juxtaposed against periods of dividend cuts. Despite its resilience in maintaining dividends for over five decades, recent financial pressures raise concerns regarding the sustainability and growth of its dividends. Strategic enhancements may be required to mitigate payout risks and improve financial metrics.
📊 Overview
Analysis of IFF's dividend profile reveals a company with historical commitment to dividends, yet present-day challenges. The sector's characteristics and the company's positioning are crucial in evaluating its investment viability.
| Category | Details |
|---|---|
| Sector | Materials |
| Dividend yield | 2.53% |
| Current dividend per share | 2.01 USD |
| Dividend history | 52 years |
| Last cut or suspension | 2024 |
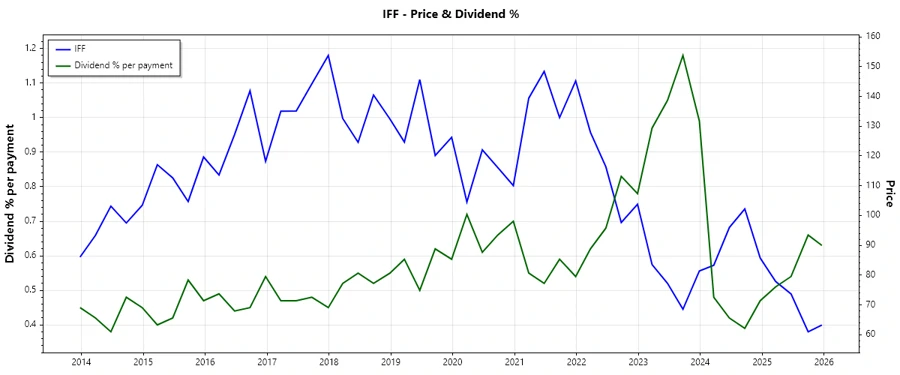
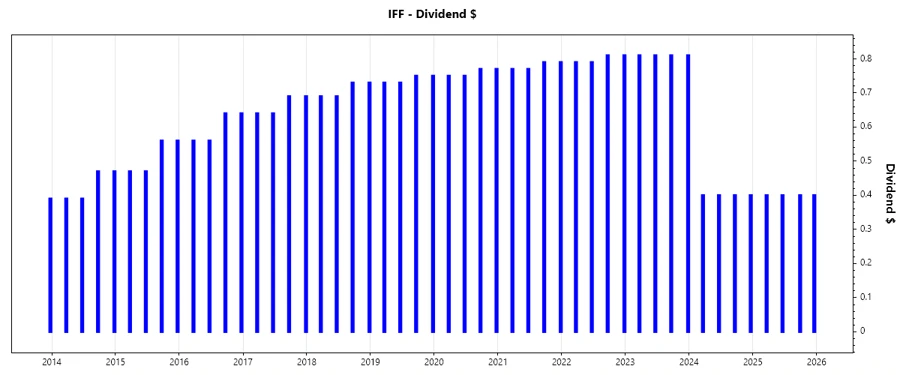
📈 Dividend History
Analyzing IFF's dividend history underscores the company's commitment to shareholder returns over decades. The firm's ability to continue this trend is critical for investor confidence.
| Year | Dividend per Share (USD) |
|---|---|
| 2025 | 1.60 |
| 2024 | 1.60 |
| 2023 | 3.24 |
| 2022 | 3.20 |
| 2021 | 3.12 |
📊 Dividend Growth
The growth metrics of dividends offer insights into the company's strategic direction in capital allocation. The current growth figures suggest reduced growth momentum compared to historical performance.
| Time | Growth |
|---|---|
| 3 years | -0.20% |
| 5 years | -0.12% |
The average dividend growth is -0.12% over 5 years. This shows a moderate decline in dividend growth, indicative of underlying financial challenges.
⚠️ Payout Ratio
The payout ratios are critical in assessing the company's ability to sustain its dividend payments. High or erratic ratios may signal unsustainable distribution policies.
| Key figure | Ratio |
|---|---|
| EPS-based | -124.76% |
| Free cash flow-based | 78.62% |
The EPS-based payout ratio of -124.76% is alarming, indicating the dividends exceed earnings. Conversely, the free cash flow-based ratio of 78.62% appears more sustainable, though still requires cautious management.
💵 Cashflow & Capital Efficiency
The analysis of cash flow and capital efficiency elucidates a company's operational health and should guide its dividend policy and growth strategies.
| Category | 2024 | 2023 | 2022 |
|---|---|---|---|
| Free Cash Flow Yield | 2.78% | 4.53% | -0.41% |
| Earnings Yield | 1.12% | -12.42% | -6.99% |
| CAPEX to Operating Cash Flow | 41.24% | 34.95% | 127.46% |
| Stock-based Compensation to Revenue | 0.67% | 0.57% | 0.39% |
| Free Cash Flow / Operating Cash Flow Ratio | 56.26% | 65.05% | -27.46% |
The cashflow metrics demonstrate a high degree of volatility, impacting IFF's capital efficiency and strategic flexibility. Adequate control over FCF is essential.
📉 Balance Sheet & Leverage Analysis
A comprehensive analysis of the balance sheet and leverage metrics provides insights into IFF's financial resilience and long-term sustainability.
| Category | 2024 | 2023 | 2022 |
|---|---|---|---|
| Debt-to-Equity | 0.69 | 0.74 | 0.67 |
| Debt-to-Assets | 0.34 | 0.35 | 0.33 |
| Debt-to-Capital | 0.41 | 0.43 | 0.40 |
| Net Debt to EBITDA | 8.56 | -10.15 | -102.29 |
| Current Ratio | 1.84 | 1.67 | 1.99 |
| Quick Ratio | 1.35 | 1.02 | 1.15 |
| Financial Leverage | 2.07 | 2.12 | 2.01 |
The leverage figures reflect a considerable debt burden, complicating efforts to bolster balance sheet strength amid fluctuating capital markets.
🗣️ Fundamental Strength & Profitability
Evaluating IFF's fundamental strength and profitability is crucial to understanding its competitive position and return potential in the market.
| Category | 2024 | 2023 | 2022 |
|---|---|---|---|
| Return on Equity | 1.75% | -17.55% | -10.58% |
| Return on Assets | 0.85% | -8.28% | -5.26% |
| Net Margin | 2.12% | -22.35% | -15.02% |
| EBIT Margin | 5.08% | -18.63% | -10.36% |
| EBITDA Margin | 13.92% | -8.68% | -0.88% |
| Gross Margin | 35.91% | 32.07% | 33.37% |
| Research & Development to Revenue | 6.23% | 5.54% | 4.85% |
Fundamental metrics suggest that IFF is struggling with profitability, reflecting a need for strategic adaptations to enhance shareholder value and competitiveness.
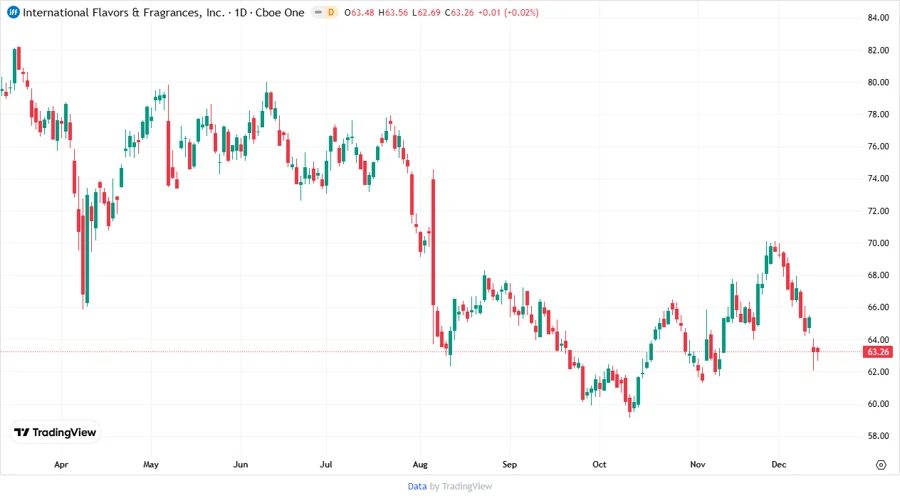
📈 Price Development
✅ Dividend Scoring System
| Category | Score | |
|---|---|---|
| Dividend yield | 3 | |
| Dividend Stability | 2 | |
| Dividend growth | 1 | |
| Payout ratio | 2 | |
| Financial stability | 2 | |
| Dividend continuity | 3 | |
| Cashflow Coverage | 1 | |
| Balance Sheet Quality | 2 |
Total Score: 16/40
🗣️ Rating
In conclusion, International Flavors & Fragrances Inc. presents a challenging investment scenario with limited dividend growth and volatility in fundamental indicators. Investors may need to weigh the current dividend yield against the firm's broader financial uncertainties before making investment decisions.