October 27, 2025 a 11:32 am
IFF: Dividend Analysis - International Flavors & Fragrances Inc.
International Flavors & Fragrances Inc. demonstrates a robust commitment to its dividend policy, given its 52-year history of consecutive payments. Despite some fluctuations in recent dividend growth rates, the company's financial resilience is noteworthy, particularly in a volatile market context. While the current dividend yield offers moderate attractiveness, stakeholders must weigh potential payout risks against this stability.
📊 Overview
International Flavors & Fragrances Inc. operates within the Consumer Staples sector, offering stable albeit conservative dividend features. The company's nuanced financial maneuvers reflect a strategic adaptation to market changes, focusing on long-term viability.
| Aspect | Details |
|---|---|
| Sector | Consumer Staples |
| Dividend yield | 2.62 % |
| Current dividend per share | 2.01 USD |
| Dividend history | 52 years |
| Last cut or suspension | None |
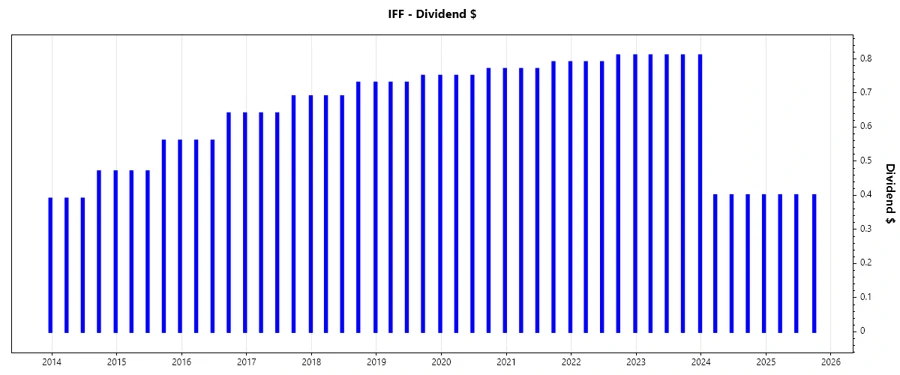
🗣️ Dividend History
The company's dividend history is a testament to its robust business model, providing assurance of income stability for investors. The lack of significant cuts or suspensions underscores management's commitment to return value to shareholders.
| Year | Dividend per Share (USD) |
|---|---|
| 2025 | 1.20 |
| 2024 | 1.60 |
| 2023 | 3.24 |
| 2022 | 3.20 |
| 2021 | 3.12 |
📈 Dividend Growth
The dividend growth metrics highlight a period of financial reassessment, with a noted decline over the past few years. Such trends may impact investor sentiment unless offset by operational improvements or strategic expansion efforts.
| Time | Growth |
|---|---|
| 3 years | -0.20 % |
| 5 years | -0.12 % |
The average dividend growth is -0.12 % over 5 years. This shows moderate but steady dividend growth.
📉 Payout Ratio
The payout ratios offer critical insight into the company's capacity to maintain its dividend policy. Given the negative earnings and EPS-based payout ratio exceeding 100%, this creates a potential risk for future payouts unless operational earnings improve materially.
| Key Figure | Ratio |
|---|---|
| EPS-based | -130.79 % |
| Free cash flow-based | 91.89 % |
Currently, the payout ratios show a concerning trend where the EPS-based ratio is negatively aligned, suggesting a strain on profit-covering dividends. In contrast, the FCF-based ratio is near cautious levels, signaling a need for prudent cash flow management.
✅ Cashflow & Capital Efficiency
The firm's cash flows and capital efficiencies are pivotal in sustaining dividend health. Despite pressures, the operational cash flows relative to free cash reflect strategic spending and efficiency efforts necessary for sustaining dividend coverage and capital investments.
| Metric | 2024 | 2023 | 2022 |
|---|---|---|---|
| Free Cash Flow Yield | 0.03 | 0.05 | -0.00 |
| Earnings Yield | 0.01 | -0.12 | -0.07 |
| CAPEX to Operating Cash Flow | 0.44 | 0.35 | 1.27 |
| Stock-based Compensation to Revenue | 0.01 | 0.01 | 0.00 |
| Free Cash Flow / Operating Cash Flow Ratio | 0.56 | 0.65 | -0.27 |
The analysis underlines an urgent need for operational income revitalization to improve cash availability and boost capital efficiency, thereby ensuring dividend adequacy.
📈 Balance Sheet & Leverage Analysis
Assessing the debt metrics offers a glimpse into the company’s financial health. The adherence to manageable leverage levels through prudent financial strategies is essential to sustaining financial stability and maintaining investor confidence.
| Metric | 2024 | 2023 | 2022 |
|---|---|---|---|
| Debt-to-Equity | 0.69 | 0.74 | 0.67 |
| Debt-to-Assets | 0.34 | 0.35 | 0.33 |
| Debt-to-Capital | 0.41 | 0.43 | 0.40 |
| Net Debt to EBITDA | 5.73 | -10.15 | -102.29 |
| Current Ratio | 1.85 | 1.67 | 1.99 |
| Quick Ratio | 1.35 | 1.02 | 1.15 |
| Financial Leverage | 2.07 | 2.12 | 2.01 |
Leverage levels reflect cautious financial maneuvering, suggesting a capacity to weather economic fluctuations though demanding continued vigilance on leverage management.
🗣️ Fundamental Strength & Profitability
Analyzing fundamental profitability reveals pivotal indicators for the company’s potential future performance. The data suggests a nuanced picture with stabilization signs that warrant investor attention.
| Metric | 2024 | 2023 | 2022 |
|---|---|---|---|
| Return on Equity | 0.02 | -0.18 | -0.11 |
| Return on Assets | 0.01 | -0.08 | -0.05 |
| Margins: Net | 0.02 | -0.22 | -0.15 |
| EBIT | 0.05 | -0.19 | -0.10 |
| EBITDA | 0.14 | -0.09 | -0.01 |
| Gross | 0.31 | 0.26 | 0.28 |
| Research & Development to Revenue | 0.06 | 0.06 | 0.05 |
The profitability analysis suggests a present challenge requiring diligent efforts to return core operational metrics to healthier margins, enhancing longer-term growth potential.
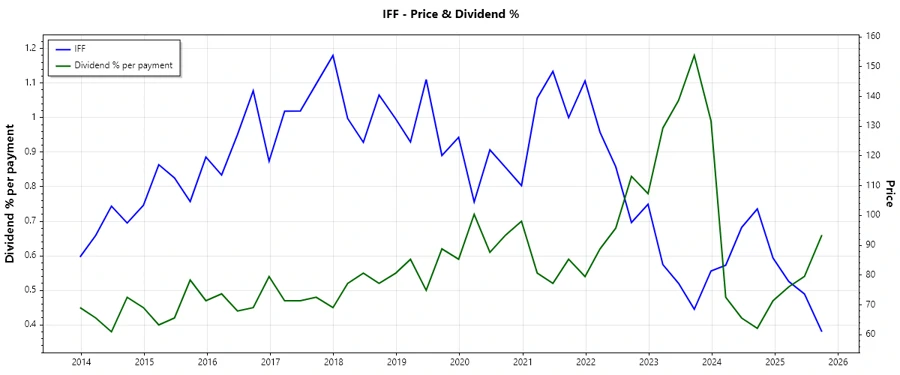
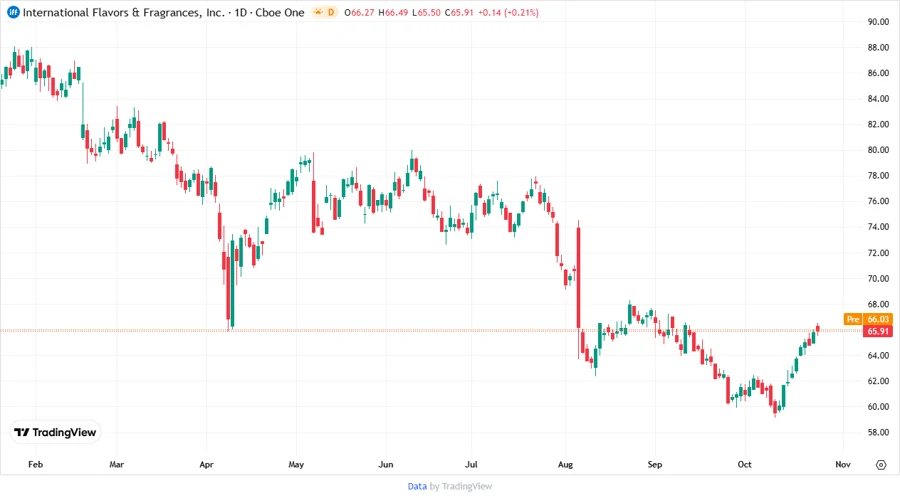
📈 Price Development
🔍 Dividend Scoring System
| Category | Score | Bar |
|---|---|---|
| Dividend yield | 3 | |
| Dividend Stability | 4 | |
| Dividend growth | 2 | |
| Payout ratio | 2 | |
| Financial stability | 3 | |
| Dividend continuity | 5 | |
| Cashflow Coverage | 3 | |
| Balance Sheet Quality | 3 |
Total Score: 25/40
🗣️ Rating
Based on the comprehensive analysis, International Flavors & Fragrances Inc. presents a mixed dividend profile. The steadfast history indicates a reliable track record. However, financial headwinds as evidenced in payout ratios and profitability metrics pose looming challenges. As such, while the long-term dividend sustainability seems strategically viable, close scrutiny of fiscal measures is advised. A moderate 'Hold' rating is given, fostering cautious optimism towards future financial recalibrations.
Smart Data Insight
Master the Perfect Entry & Exit for this Stock
Don't leave your profits to chance. Historically, this stock follows specific seasonal patterns that institutional traders use to maximize returns.
- ✅ Identify the "Golden Buying Window"
- ✅ Avoid high-risk correction cycles
- ✅ Backtested data from the last 20+ years