October 12, 2025 a 12:46 pm
IFF: Dividend Analysis - International Flavors & Fragrances Inc.
International Flavors & Fragrances Inc. (IFF) has a longstanding history in dividend distribution, boasting a historical record of 52 years without a cut. Despite recent challenges, including a negative EPS payout ratio, the company remains committed to delivering returns to its shareholders. With a current dividend yield of 2.62%, IFF represents a complex investment scenario with both risks and opportunities.
📊 Overview
Assessing International Flavors & Fragrances Inc.'s financial standing and dividend metrics provides insights into the potential benefits and risks for investors.
| Metric | Value |
|---|---|
| Sector | Chemicals |
| Dividend yield | 2.62 % |
| Current dividend per share | $2.01 |
| Dividend history | 52 years |
| Last cut or suspension | None |
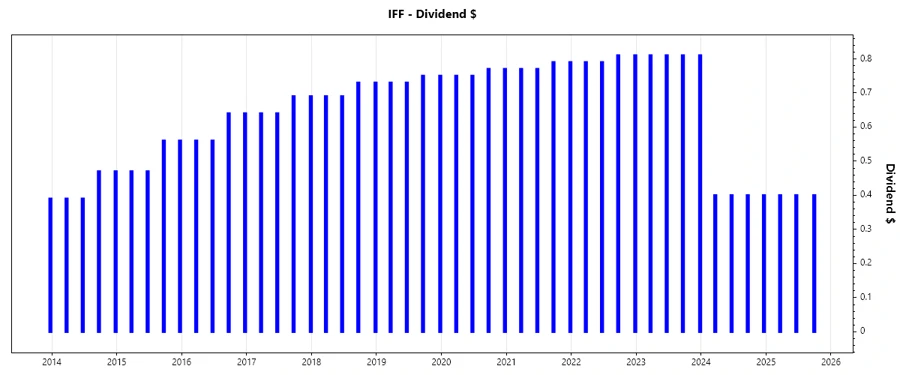
📈 Dividend History
Understanding the dividend history of International Flavors & Fragrances Inc. reveals the consistency and reliability of its payout strategy, essential for income-focused investors.
| Year | Dividend Per Share (USD) |
|---|---|
| 2025 | 1.2 |
| 2024 | 1.6 |
| 2023 | 3.24 |
| 2022 | 3.20 |
| 2021 | 3.12 |
📉 Dividend Growth
The analysis of dividend growth provides valuable insights into the company’s potential for long-term investment. Recently, IFF has seen negative growth over both 3-year and 5-year periods, a crucial indicator for potential investors.
| Time | Growth |
|---|---|
| 3 years | -19.96 % |
| 5 years | -11.58 % |
The average dividend growth is -11.58% over 5 years. This indicates a declining trend that may concern investors focused on growth.
✅ Payout Ratio
The payout ratio is a key metric indicating how sustainable a dividend payout is relative to company earnings.
| Key Figure | Ratio |
|---|---|
| EPS-based | -130.79 % |
| Free cash flow-based | 91.89 % |
The EPS-based payout ratio of -130.79% indicates that the company is paying dividends in excess of its earnings, pointing towards an unsustainable payout. In contrast, the FCF-based ratio suggests more stability but still hovers near the upper sustainable limit.
💰 Cashflow & Capital Efficiency
Cash flow indicators are vital for assessing the financial strength and operational efficiency of a company.
| Metric | 2024 | 2023 | 2022 |
|---|---|---|---|
| Free Cash Flow Yield | 2.78 % | 4.53 % | -0.41 % |
| Earnings Yield | 1.12 % | -12.42 % | -6.99 % |
| CAPEX to Operating Cash Flow | 43.74 % | 34.95 % | 127.46 % |
| Stock-based Compensation to Revenue | 0.67 % | 0.57 % | 0.39 % |
| Free Cash Flow / Operating Cash Flow Ratio | 56.26 % | 65.05 % | -27.46 % |
The cash flow stability is compromised by the negative earnings yield and high CAPEX requirements, suggesting cautious optimism with an eye on capital efficiency improvements.
🔍 Balance Sheet & Leverage Analysis
The balance sheet's components help in understanding the financial leverage and overall financial stability of the company.
| Metric | 2024 | 2023 | 2022 |
|---|---|---|---|
| Debt-to-Equity | 69.34 % | 74.07 % | 66.53 % |
| Debt-to-Assets | 33.56 % | 34.94 % | 33.06 % |
| Debt-to-Capital | 40.95 % | 42.55 % | 39.95 % |
| Net Debt to EBITDA | 5.73 | -10.15 | -102.29 |
| Current Ratio | 1.85 | - | 1.99 |
| Quick Ratio | 1.35 | 1.02 | 1.15 |
| Financial Leverage | 2.07 | 2.12 | 2.01 |
The leverage ratios indicate a moderate leverage position, but the unstable net debt to EBITDA highlights concerns around debt management and interest coverage.
🔍 Fundamental Strength & Profitability
Evaluating fundamental strength involves looking at profitability metrics like margins and return ratios that reflect the company’s efficiency.
| Metric | 2024 | 2023 | 2022 |
|---|---|---|---|
| Return on Equity | 1.75 % | -17.56 % | -10.58 % |
| Return on Assets | 0.85 % | -8.28 % | -5.26 % |
| Margins: Net | 2.12 % | -22.35 % | -15.02 % |
| Margins: EBIT | 5.08 % | -18.63 % | -10.36 % |
| Margins: EBITDA | 13.92 % | -8.68 % | -0.88 % |
| Margins: Gross | 30.58 % | 26.13 % | 27.52 % |
| Research & Development to Revenue | 5.84 % | 5.54 % | 4.85 % |
The negative profitability ratios reflect poor operational performance, demanding strategic focus to enhance margins and return metrics.
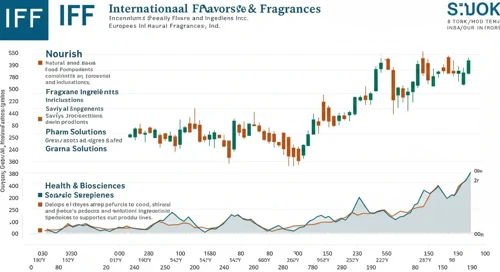
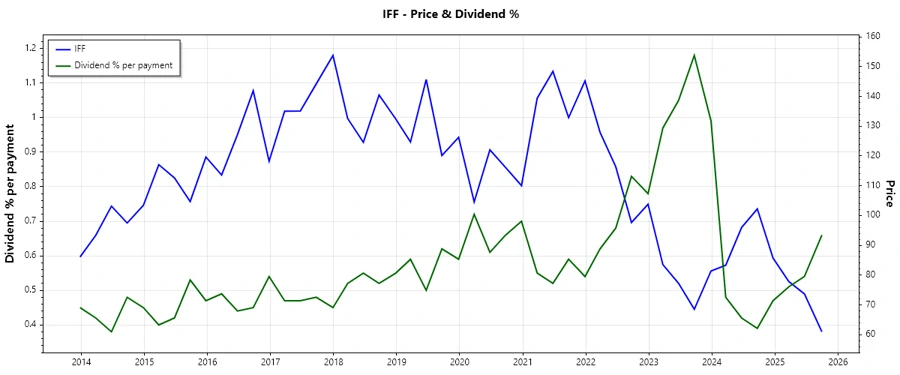
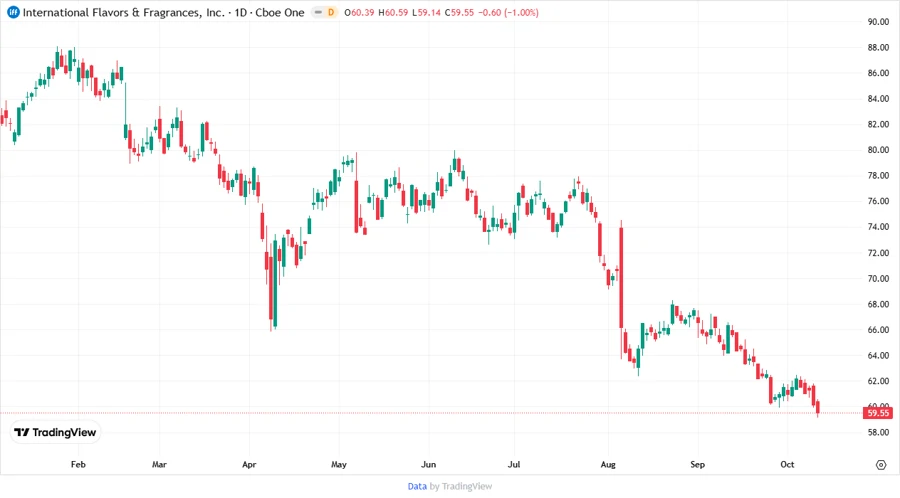
📊 Price Development
📈 Dividend Scoring System
| Category | Score | Evaluation |
|---|---|---|
| Dividend yield | 3 | |
| Dividend Stability | 4 | |
| Dividend growth | 1 | |
| Payout ratio | 2 | |
| Financial stability | 3 | |
| Dividend continuity | 4 | |
| Cashflow Coverage | 3 | |
| Balance Sheet Quality | 2 |
Total Score: 22/40
✅ Rating
International Flavors & Fragrances Inc. presents a mixed bag with moderate dividend yield and stability but faces challenges in profitability and payout sustainability. The recommendation is to hold for existing investors but exercise caution for new positions unless strategic improvements materialize.
Smart Data Insight
Master the Perfect Entry & Exit for this Stock
Don't leave your profits to chance. Historically, this stock follows specific seasonal patterns that institutional traders use to maximize returns.
- ✅ Identify the "Golden Buying Window"
- ✅ Avoid high-risk correction cycles
- ✅ Backtested data from the last 20+ years