September 02, 2025 a 02:47 am


IFF: Dividend Analysis - International Flavors & Fragrances Inc.
International Flavors & Fragrances Inc. (IFF) demonstrates a long-standing history of dividend payments, showcasing its commitment to rewarding shareholders. However, recent negative growth in dividends over the past five years highlights potential challenges that the company faces in maintaining its dividend policy. Despite these challenges, IFF's extensive track record suggests resilience, making it a company to watch closely.
📊 Overview
The overview provides a snapshot of IFF's current dividend metrics, essential for assessing the company's ability to deliver shareholder returns consistently.
| Metric | Value |
|---|---|
| Sector | Consumer Goods |
| Dividend yield | 2.37 % |
| Current dividend per share | 2.01 USD |
| Dividend history | 52 years |
| Last cut or suspension | None |
🗣️ Dividend History
With a 52-year history of dividend payments, IFF demonstrates a robust commitment to its shareholders. Analyzing past dividend payouts is crucial for predictions about future dividend reliability and growth.
| Year | Dividend Per Share (USD) |
|---|---|
| 2025 | 1.20 |
| 2024 | 1.60 |
| 2023 | 3.24 |
| 2022 | 3.20 |
| 2021 | 3.12 |
📈 Dividend Growth
Recent dividend growth trends highlight challenges with a negative growth rate over both 3 and 5 years. This data is vital for evaluating the long-term potential of dividends as an income stream.
| Time | Growth |
|---|---|
| 3 years | -0.20 % |
| 5 years | -0.12 % |
The average dividend growth is -0.12 % over 5 years. This shows moderate but steady dividend decline.
💰 Payout Ratio
The payout ratio is pivotal in assessing the sustainability of dividends. It's the percentage of earnings paid to shareholders in dividends.
| Key figure | Ratio |
|---|---|
| EPS-based | -130.79 % |
| Free cash flow-based | 214.41 % |
Concerns arise as both the EPS and FCF payout ratios suggest that IFF is paying out more in dividends than it earns, indicating unsustainable dividend payments.
💵 Cashflow & Capital Efficiency
Analyzing cash flow and capital efficiency figures provides insight into how well a company generates cash and manages its capital investment.
| Metric | 2024 | 2023 | 2022 |
|---|---|---|---|
| Free Cash Flow Yield | 0.0280 | 0.0453 | -0.0060 |
| Earnings Yield | 0.0112 | -0.1242 | -0.0687 |
| CAPEX to Operating Cash Flow | 0.4327 | 0.3495 | 1.4667 |
| Stock-based Compensation to Revenue | 0.0067 | 0.0057 | 0.0039 |
| Free Cash Flow / Operating Cash Flow Ratio | 0.5673 | 0.6505 | -0.4667 |
The analysis shows worrying signs in cash flow efficiency with high negative past ratios, indicating possible inefficiency in capital use.
📊 Balance Sheet & Leverage Analysis
A company’s leverage and solvency are crucial measures of financial health, providing insights into debt management and liquidity.
| Metric | 2024 | 2023 | 2022 |
|---|---|---|---|
| Debt-to-Equity | 0.6934 | 0.7407 | 0.6653 |
| Debt-to-Assets | 0.3356 | 0.3494 | 0.3306 |
| Debt-to-Capital | 0.4095 | 0.4255 | 0.3995 |
| Net Debt to EBITDA | 5.7272 | -10.1546 | -102.291 |
| Current Ratio | 1.8498 | 1.6746 | 1.9936 |
| Quick Ratio | 1.3524 | 1.0154 | 1.1483 |
| Financial Leverage | 2.0659 | 2.1202 | 2.0120 |
While leverage ratios remain manageable, the negative EBITDA figures suggest potential distress and high risk for financial stability.
🧮 Fundamental Strength & Profitability
Assessing profitability and core financial strength metrics is essential for understanding the company's ability to generate profits consistently.
| Metric | 2024 | 2023 | 2022 |
|---|---|---|---|
| Return on Equity | 0.0175 | -0.1756 | -0.1040 |
| Return on Assets | 0.0085 | -0.0828 | -0.0517 |
| Margins: Net | 0.0212 | -0.2235 | -0.1476 |
| EBIT | 0.0508 | -0.1863 | -0.1036 |
| EBITDA | 0.1392 | -0.0868 | -0.0088 |
| Gross | 0.3591 | 0.3207 | 0.3337 |
| Research & Development to Revenue | 0.0584 | 0.0554 | 0.0485 |
While gross margins remain relatively stable, the negative margins highlight issues with profitability, suggesting underlying operational inefficiencies.
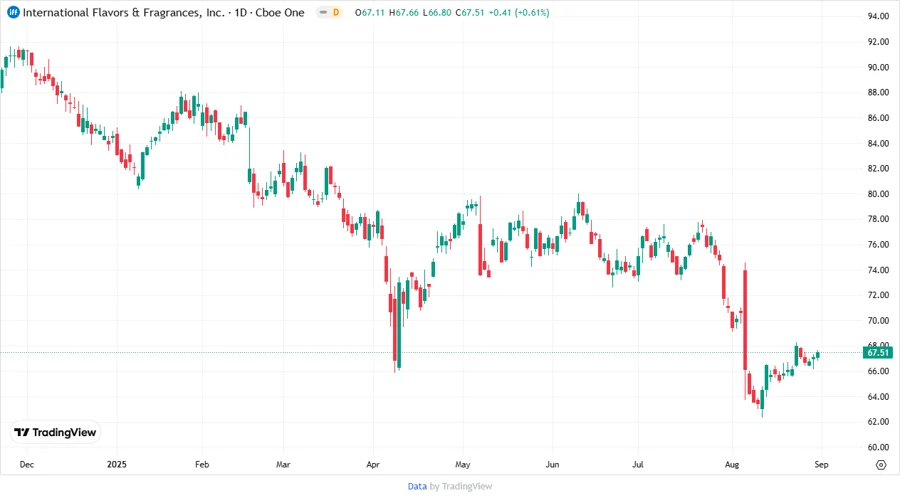
📉 Price Development
✅ Dividend Scoring System
| Criteria | Score | |
|---|---|---|
| Dividend yield | 3 | |
| Dividend Stability | 2 | |
| Dividend growth | 1 | |
| Payout ratio | 1 | |
| Financial stability | 2 | |
| Dividend continuity | 3 | |
| Cashflow Coverage | 1 | |
| Balance Sheet Quality | 2 |
Total Score: 15/40
💡 Rating
IFF exhibits potential concerns with dividend sustainability and profitability challenges, reflected in its below-average dividend growth and payout ratios. While it boasts a strong history of dividends, caution is advised for investors seeking stable and growing dividends. Monitoring financial health and operational efficiency will be crucial in future assessments.
Smart Data Insight
Master the Perfect Entry & Exit for this Stock
Don't leave your profits to chance. Historically, this stock follows specific seasonal patterns that institutional traders use to maximize returns.
- ✅ Identify the "Golden Buying Window"
- ✅ Avoid high-risk correction cycles
- ✅ Backtested data from the last 20+ years