October 20, 2025 a 09:03 am


IEX: Trend and Support & Resistance Analysis - IDEX Corporation
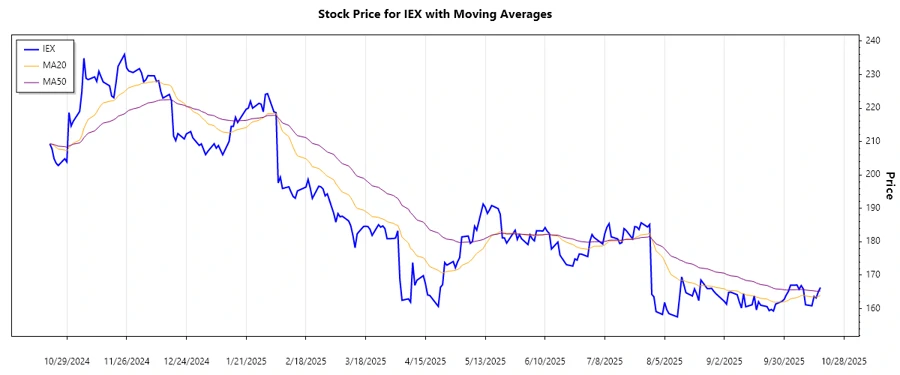
The IDEX Corporation (IEX) has recently exhibited fluctuations in its stock price, with a tendency towards stabilization in its current range. Known for providing global applied solutions across various sectors, the firm's stock performance mirrors its diversified business operations. Technical analysis shows that recent price actions have delineated distinct support and resistance levels, crucial for potential investment strategies.
Trend Analysis
To assess the trend, we calculated the 20-day and 50-day exponential moving averages (EMA20 and EMA50) from the provided price data. The intersection of these EMAs often indicates crucial turning points in the market trend. Based on the analysis of historical close prices, the current EMA20 and EMA50 suggest the following:
| Date | Close Price | Trend |
|---|---|---|
| 2025-10-17 | 166.31 | ⚖️ Sideways |
| 2025-10-16 | 165.03 | ▲ Up |
| 2025-10-15 | 163.19 | ▼ Down |
| 2025-10-14 | 163.65 | ▼ Down |
| 2025-10-13 | 160.84 | ▼ Down |
| 2025-10-10 | 161.16 | ▲ Up |
| 2025-10-09 | 165.85 | ▲ Up |
Currently, the trend oscillates slightly, reflecting potential indecision or stabilizing phases post-recent volatility.
Support and Resistance
Through analyzing historical price movements, it is possible to pinpoint zones which likely act as psychological barriers for investors. These zones are derived from the price levels at which the stock has historically reversed direction:
| Zone Type | From | To |
|---|---|---|
| Support 1 | 159.50 | 161.00 |
| Support 2 | 162.50 | 164.00 |
| Resistance 1 | 166.50 | 168.00 |
| Resistance 2 | 169.50 | 171.00 |
At present, the close price is hovering near the upper threshold of the second support zone, implying potential support at these levels. Continued strength above this zone may signal further ascent towards resistance levels.
Conclusion
In summary, IDEX Corporation (IEX) reveals a pattern of stabilization within its trading range, underpinned by identifiable support and resistance levels. The EMA analysis suggests a sideways trend, indicative of consolidation phases. For analysts and investors, these technical indicators provide a window into potential trading opportunities, highlighting the significance of breakthrough points that could align with broader market dynamics. Vigilance on price movements relative to these levels will be crucial in forecasting the stock’s trajectory.
Smart Data Insight
Master the Perfect Entry & Exit for this Stock
Don't leave your profits to chance. Historically, this stock follows specific seasonal patterns that institutional traders use to maximize returns.
- ✅ Identify the "Golden Buying Window"
- ✅ Avoid high-risk correction cycles
- ✅ Backtested data from the last 20+ years