October 02, 2025 a 09:03 am
IEX: Trend and Support & Resistance Analysis - IDEX Corporation
IDEX Corporation (IEX) has shown mixed results over the past few months, reflecting its diverse business segments. Currently, the stock appears to have been in a corrective phase with a recent downturn. Investors should be cautious in the short term, while keeping an eye on the broader business performance in its respective markets. Potential zones of support and resistance are apparent, which could offer trading opportunities.
Trend Analysis
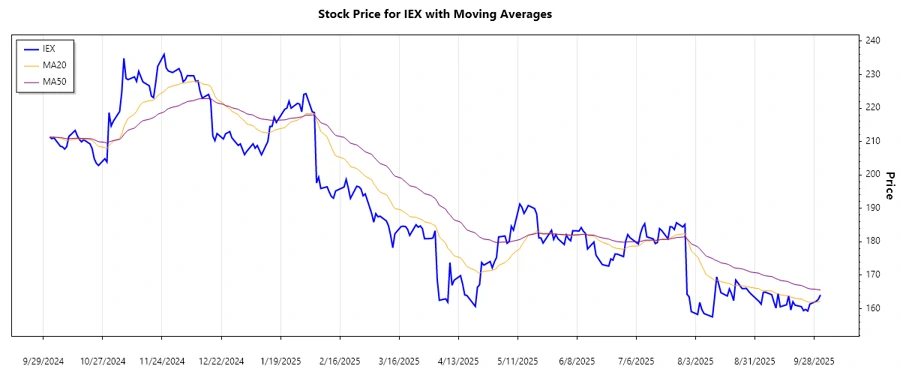
To understand the current trend, we analyze the 20-day (EMA20) and 50-day (EMA50) exponential moving averages to capture the short to mid-term sentiment.
| Date | Close Price | Trend |
|---|---|---|
| 2025-10-01 | 164.10 | ▼ |
| 2025-09-30 | 162.76 | ▼ |
| 2025-09-29 | 162.19 | ▼ |
| 2025-09-26 | 161.35 | ▼ |
| 2025-09-25 | 159.28 | ▼ |
| 2025-09-24 | 159.76 | ▼ |
| 2025-09-23 | 159.40 | ▼ |
The current trend indicates a persistent decline as the EMA20 < EMA50, suggesting that IDEX is in a downturn phase. Investors should monitor the reversal signals before considering long positions.
Support and Resistance
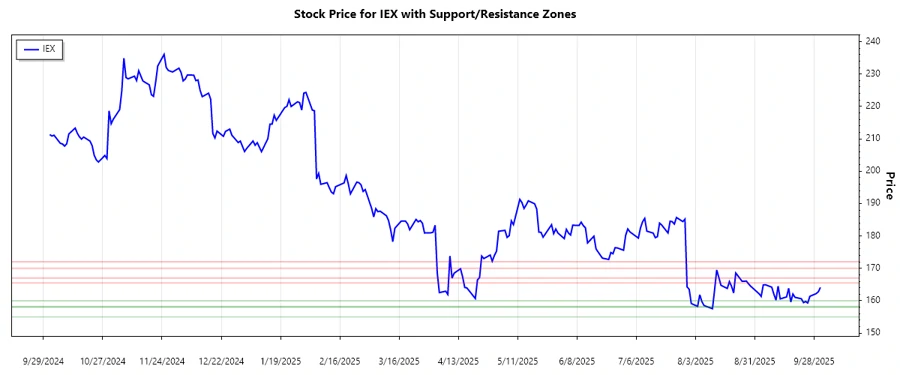
Key support and resistance zones indicate potential levels where the stock may experience buying or selling pressure.
| Zone Type | Zone Range |
|---|---|
| Support | 158.20 - 160.00 |
| Support | 155.00 - 158.00 |
| Resistance | 165.50 - 167.00 |
| Resistance | 170.00 - 172.00 |
The current price is just above a support zone, suggesting stability might be nearby. However, traders should wait for confirmation of a bounce before placing buy orders.
Conclusion
IDEX Corporation's stock is currently exhibiting a bearish trend with possible stability at nearby support levels. The ongoing downtrend might impose risks for short-term investors, but potential support zones could offer a stabilization point. Long-term investors should consider the company's fundamental strengths in its diverse market segments. Monitoring global industry trends will be crucial for evaluating IEX's future performance. Ultimately, a clear breakout or reversal pattern may provide a better entry point for traders.
Smart Data Insight
Master the Perfect Entry & Exit for this Stock
Don't leave your profits to chance. Historically, this stock follows specific seasonal patterns that institutional traders use to maximize returns.
- ✅ Identify the "Golden Buying Window"
- ✅ Avoid high-risk correction cycles
- ✅ Backtested data from the last 20+ years