September 12, 2025 a 03:15 am

IEX: Trend and Support & Resistance Analysis - IDEX Corporation
IDEX Corporation, operating in diverse segments like Fluid & Metering Technologies and Health & Science Technologies, shows a complex financial landscape. An analysis of the recent stock performance indicates a series of price fluctuations with potential opportunities in the technical trends. Understanding support and resistance zones is crucial for anticipating future price movements. This report provides a detailed analysis based on current market trends and price behavior.
Trend Analysis
| Date | Close Price | Trend |
|---|---|---|
| 2025-09-11 | 164.49 | ▼ Downward |
| 2025-09-10 | 160.17 | ▼ Downward |
| 2025-09-09 | 162.01 | ▲ Upward |
| 2025-09-08 | 164.17 | ▲ Upward |
| 2025-09-05 | 164.93 | ⚖️ Side |
| 2025-09-04 | 164.86 | ⚖️ Side |
| 2025-09-03 | 161.32 | ▼ Downward |
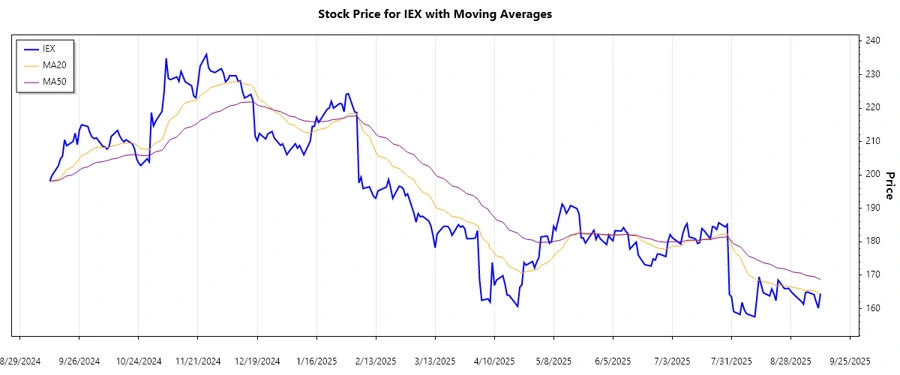
The EMA20 has dropped below the EMA50, indicating a ▼ downward trend. Such a movement suggests bearish market sentiment. Close monitoring is necessary as moving below the support zones could enhance a bearish outlook.
Support- and Resistance
| Zone Type | From | To | |
|---|---|---|---|
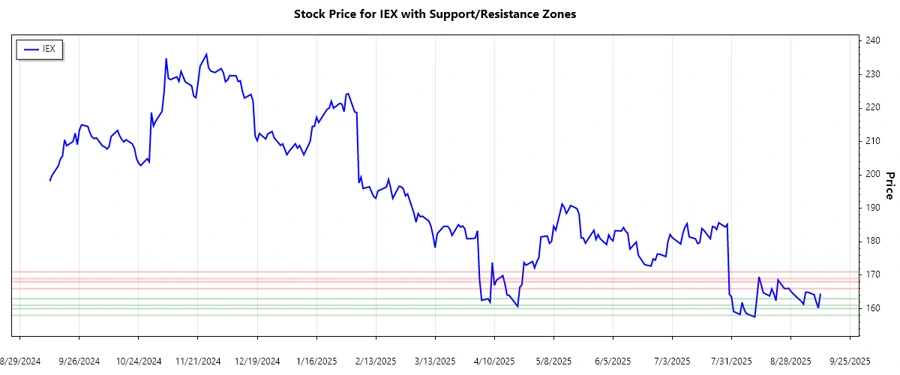
| Support Zone 1 | 158.00 | 160.00 | ▲ |
| Support Zone 2 | 161.00 | 163.00 | ▲ |
| Resistance Zone 1 | 166.00 | 168.00 | ▼ |
| Resistance Zone 2 | 169.00 | 171.00 | ▼ |
Currently, the stock price sits close to the lower support zone, an area of potential buying interest. If the price sustains above 161.00, it could signal strength. Conversely, failing to uphold this level might result in additional declines.
The analysis suggests cautious optimism. While IDEX is experiencing a ▼ downward trend, it currently rests near a significant support level, hinting at potential reversal opportunities. However, if prices breach the support zone downward, it could lead to further declines. Investors should weigh the diverse operational segments of IDEX and their contributions to resilience and risk. On the flip side, breach of significant resistance levels could hint at renewed bullish momentum.
Smart Data Insight
Master the Perfect Entry & Exit for this Stock
Don't leave your profits to chance. Historically, this stock follows specific seasonal patterns that institutional traders use to maximize returns.
- ✅ Identify the "Golden Buying Window"
- ✅ Avoid high-risk correction cycles
- ✅ Backtested data from the last 20+ years