July 26, 2025 a 04:03 am
IEX: Trend and Support & Resistance Analysis - IDEX Corporation
The recent trend in the IDEX Corporation stock shows a dynamic market environment, with momentous changes over the past few months. By examining moving averages and price actions, we can gain valuable insights into the stock's potential performance. The company, engaged in manufacturing industry-leading technologies, continues to be a significant player in the markets it serves.
Trend Analysis
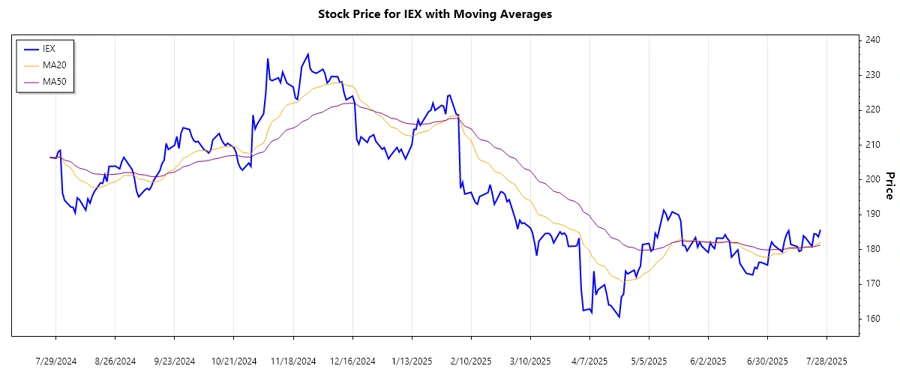
Upon analyzing the recent daily closing prices, the calculation of EMA20 and EMA50 suggests a general market movement.
| Date | Close Price | Trend |
|---|---|---|
| 2025-07-25 | 185.69 | ▲ Uptrend |
| 2025-07-24 | 183.66 | ▲ Uptrend |
| 2025-07-23 | 184.4 | ▲ Uptrend |
| 2025-07-22 | 184.54 | ▲ Uptrend |
| 2025-07-21 | 180.9 | ▼ Downtrend |
| 2025-07-18 | 183.38 | ▲ Uptrend |
| 2025-07-17 | 183.96 | ▲ Uptrend |
Based on the calculated EMAs, the current dominant trend points towards an uptrend.
Support and Resistance
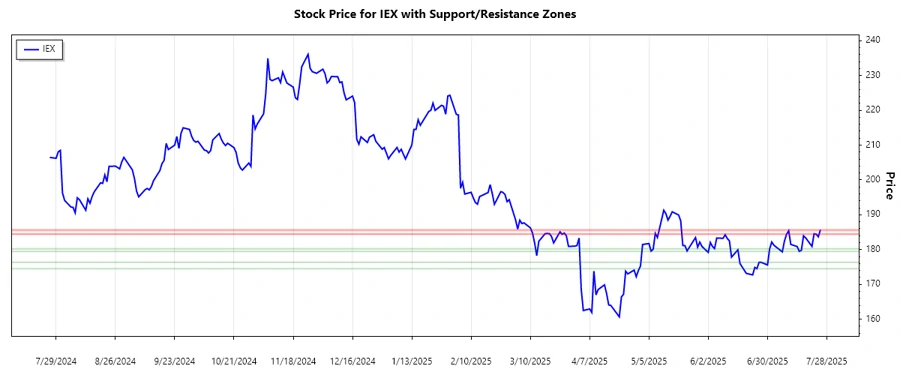
Analyzing recent price actions gives insight into key support and resistance levels.
| Zone Type | From | To |
|---|---|---|
| Support Zone | 179.47 | 180.19 |
| Support Zone | 174.5 | 176.35 |
| Resistance Zone | 185.42 | 185.69 |
| Resistance Zone | 184.38 | 184.54 |
The current market price appears to be approaching the higher resistance zone, suggesting pressure to break above this level.
Conclusion
The IDEX Corporation's stock is showing a promising uptrend according to recent EMA analyses. Investors should be cautious of the approaching resistance levels, which could either bolster the bullish sentiment or result in temporary price pullbacks. As the company is well-grounded in key technological markets, its long-term performance remains positive. Nevertheless, regular monitoring of the identified price zones is advisable for timely entry and exit decisions.
Smart Data Insight
Master the Perfect Entry & Exit for this Stock
Don't leave your profits to chance. Historically, this stock follows specific seasonal patterns that institutional traders use to maximize returns.
- ✅ Identify the "Golden Buying Window"
- ✅ Avoid high-risk correction cycles
- ✅ Backtested data from the last 20+ years